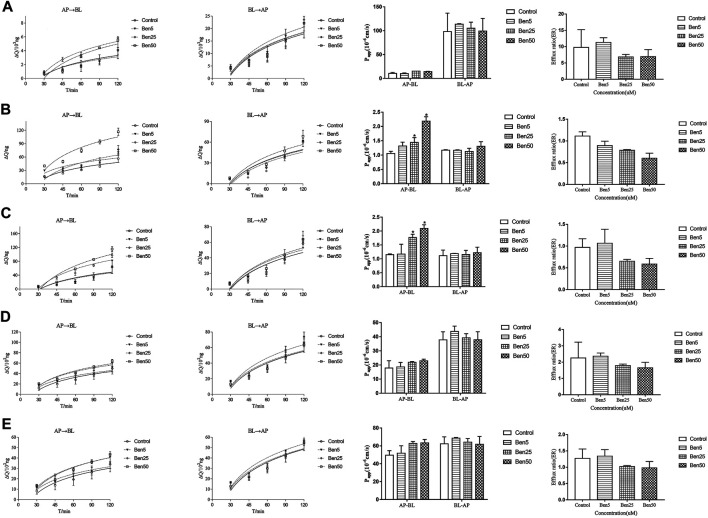
FIGURE 1.
Effect of benzaldehyde on transmembrane transport study. Concentration of benzaldehyde molecules. From the left to right were the accumulation and Papp of marker drugs across AP-BL and BL-AP, the efflux of marker drugs. (A) VIN; (B) ACV; (C) HTZ; (D) PRO; and (E) CAR. *p < 0.05 meant compared to the control group (no benzaldehyde). Data are shown as the mean ± SD.

