
FIGURE 3.
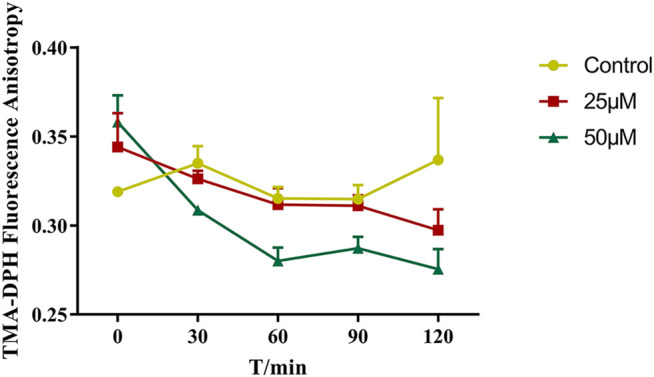
The changes in the fluorescence anisotropy of TMA-DPH in Caco-2 cells with different concentrations of benzaldehyde molecules. (●) HBSS, (■) 25 μM benzaldehyde, (▲) 100 μM benzaldehyde. Data are shown as the mean ± SD.
Official websites use .gov
A
.gov website belongs to an official
government organization in the United States.
Secure .gov websites use HTTPS
A lock (
) or https:// means you've safely
connected to the .gov website. Share sensitive
information only on official, secure websites.
The changes in the fluorescence anisotropy of TMA-DPH in Caco-2 cells with different concentrations of benzaldehyde molecules. (●) HBSS, (■) 25 μM benzaldehyde, (▲) 100 μM benzaldehyde. Data are shown as the mean ± SD.