
FIGURE 4.
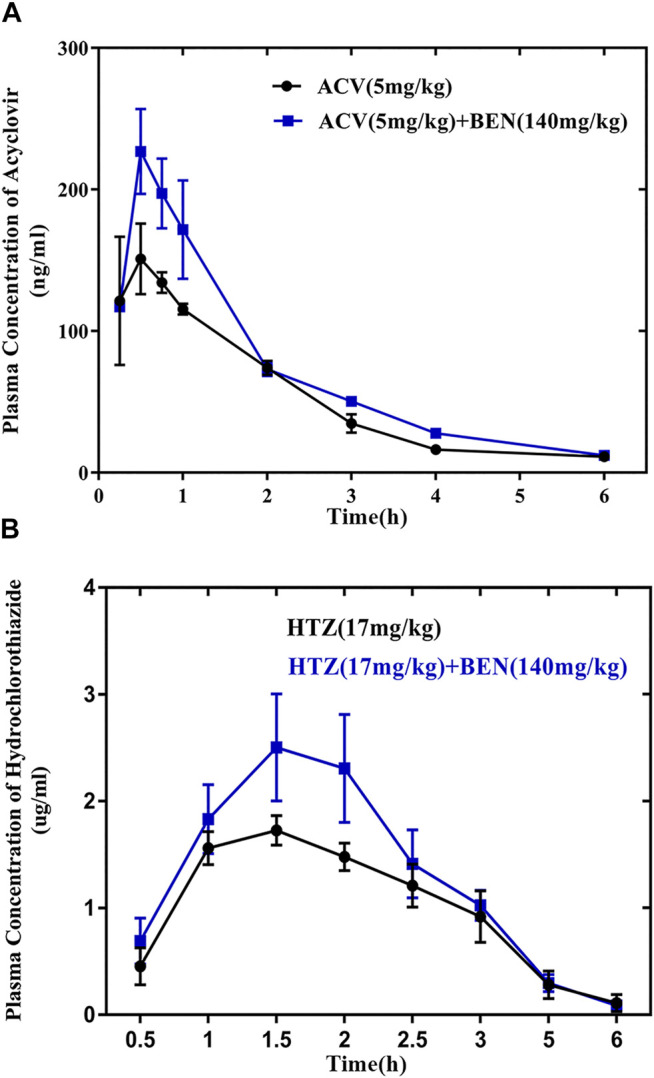
The absorption-promoting effects of benzaldehyde for acyclovir (ACV) and hydrochlorothiazide (HTZ) in vivo. (A) Mean plasma concentration–time profile of acyclovir with or without benzaldehyde. (●) Control group (acyclovir 5 mg/kg), (■) 140 mg/kg benzaldehyde (acyclovir 5 mg/kg). (B) Mean plasma concentration–time profile of hydrochlorothiazide with or without benzaldehyde. (●) Control group (hydrochlorothiazide 17 mg/kg), (■) 140 mg/kg benzaldehyde (hydrochlorothiazide 17 mg/kg).