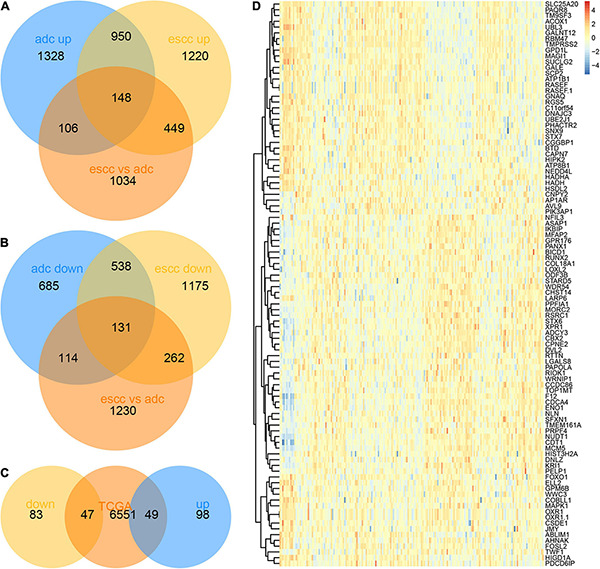
FIGURE 5.

Identification of hub tumor progression genes between esophageal adenocarcinoma (EA) and esophageal squamous cell carcinoma (ESCC). (A) One hundred forty-seven common induced genes that was also differently expressed between EA and ESCC were identified using Venn diagram. (B) One hundred thirty common reduced genes that was also differently expressed between EA and ESCC were identified using Venn diagram. (C) The differently expressed genes between esophageal cancer (EC) and normal samples were shown using heatmap. (D) Forty-seven common reduced and 49 common induced genes were also differently expressed in EC samples compared to normal samples using The Cancer Genome Atlas (TCGA) database.
