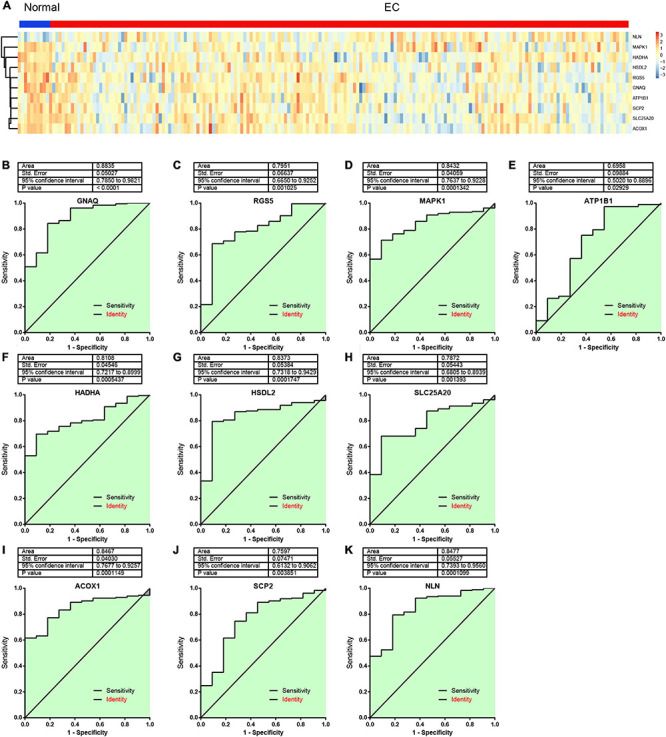
FIGURE 7.

The area under the curve (AUC) analysis of hub genes for distinguishing esophageal cancer (EC) samples from normal tissues. (A) The expression levels of hub genes in EC and normal samples were analyzed using The Cancer Genome Atlas (TCGA) database. (B–K) The area under the curve (AUC) analysis of GNAQ (B), RGS5 (C), MAPK1 (D), ATP1B1 (E), HADHA (F), HSDL2 (G), SLC25A20 (H), ACOX1 (I), SCP2 (J), and NLN (K) for distinguishing EC samples from normal tissues.
