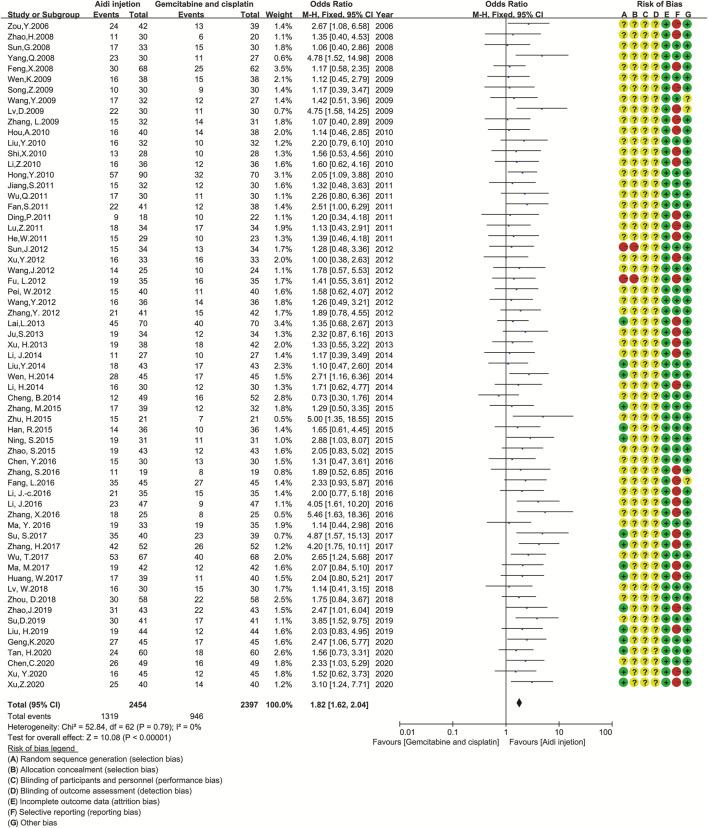
FIGURE 3.
The analysis of tumor response between two groups 3a.The analysis of ORR between two groups. The pooled result showed a significant improvement in ORR in the Aidi and GP combination group compared to that in the control group (OR = 1.82, 95% CI [1.62 to 2.04], p < 0.00001). Note: GP, Gemcitabine, and cisplatin; ORR, objective response rate. 3b. The analysis of DCR between two groups. The pooled result showed a significant improvement in DCR in the Aidi and GP combination group compared to that in the control group (OR = 2.29, 95% CI [1.97 to 2.67], p < 0.00001). Note: GP, Gemcitabine, and cisplatin; DCR, disease control rate.

