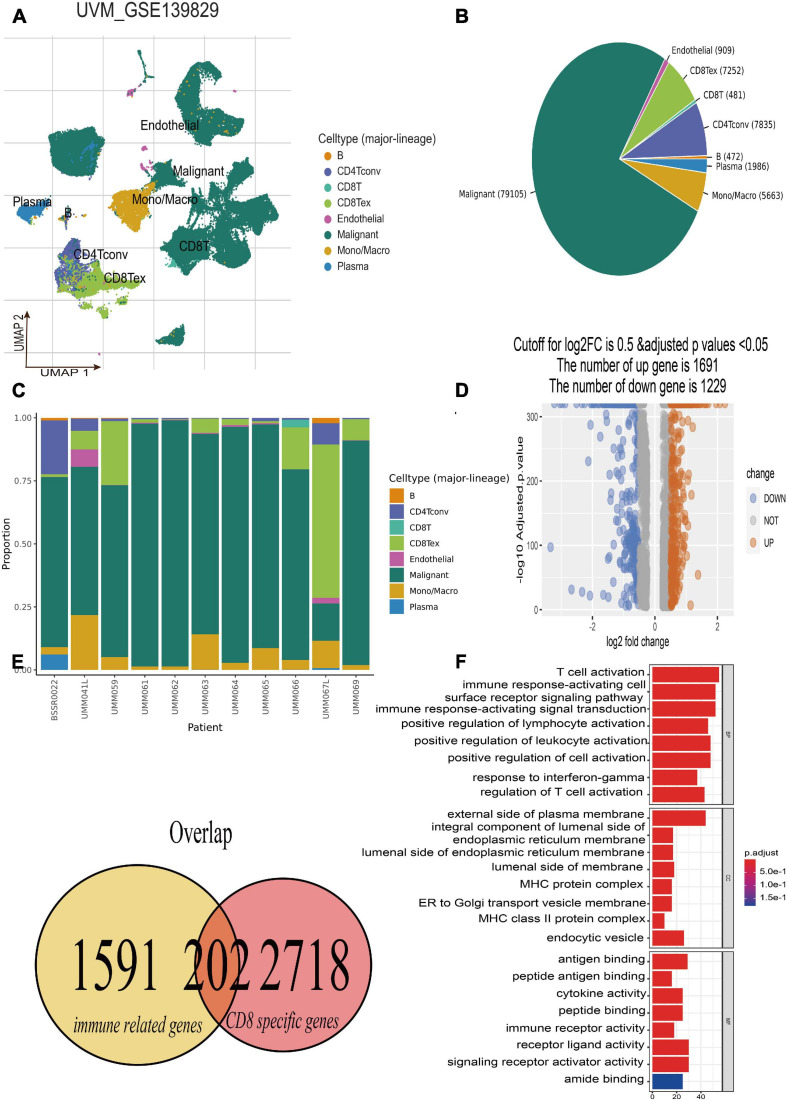
FIGURE 2.
Identification of CD8+ T-cell-associated immune-related genes (CDIRGs). (A) The landscape of UM single-cell samples; annotated UMAP plot identified a total of eight different cell types including B cells, CD4+ T cells, CD8+ T and T exhausted cells, endothelial, malignant, mono/macrophage, and plasma. (B) The pie plot of eight different cell types. Apart from malignant cells, CD8+ T exhausted cells take a larger component. (C) The bar plot for proportion of eight different cell types. (D) The volcano plot of the different expressed genes (DEGs) in CD8+ T cells. (E) The overlapped CDIRGs of DEGs and immune-related genes. (F) Gene Ontology (GO) enrichment analysis of the CDIRGs.

