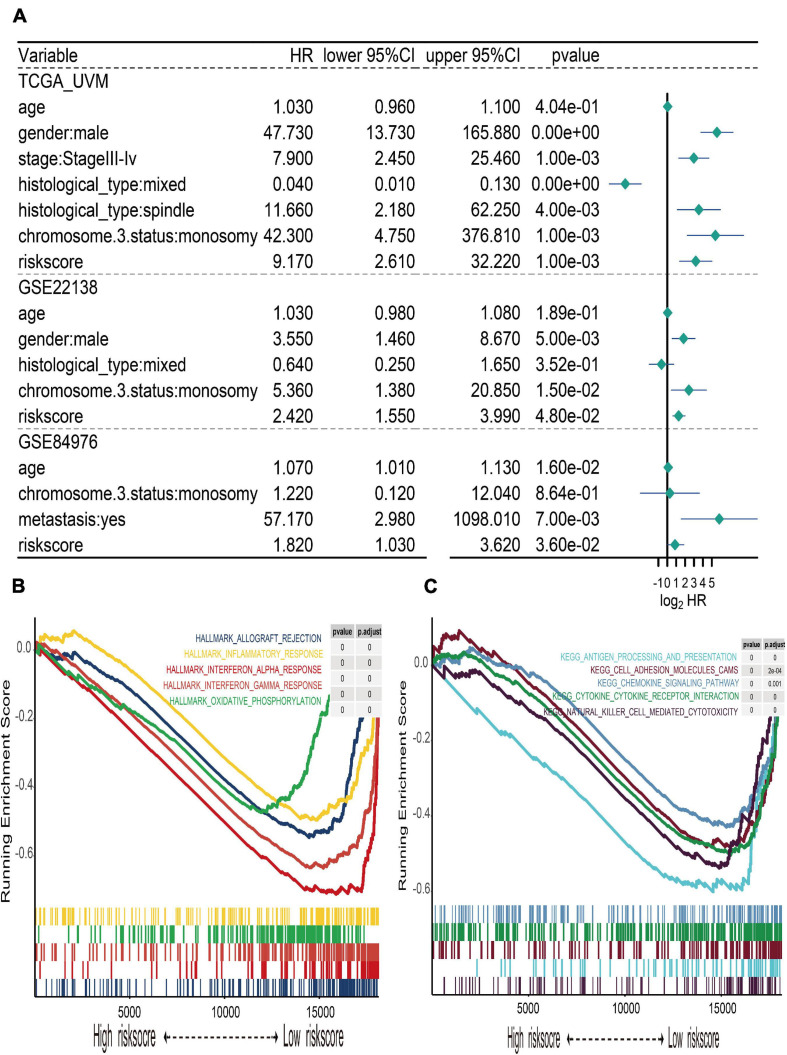
FIGURE 6.
Multivariate Cox regression of risk score and gene set enrichment analysis (GSEA). (A) Forest plot of multivariate Cox regression for risk score and clinical characteristics in TCGA, GSE22138, and GSE84976 datasets. (B) The top five cancer hallmarks include allograft rejection, inflammatory response, interferon alpha and gamma response, and oxidative phosphorylation, which were enriched in the low-risk group. (C) The results of KEGG enrichment included antigen processing and presentation, cell adhesion molecule cams, chemokine signaling pathway, cytokine–cytokine receptor interaction, and natural killer cell-mediated cytotoxicity, which were active in the low-risk group.

