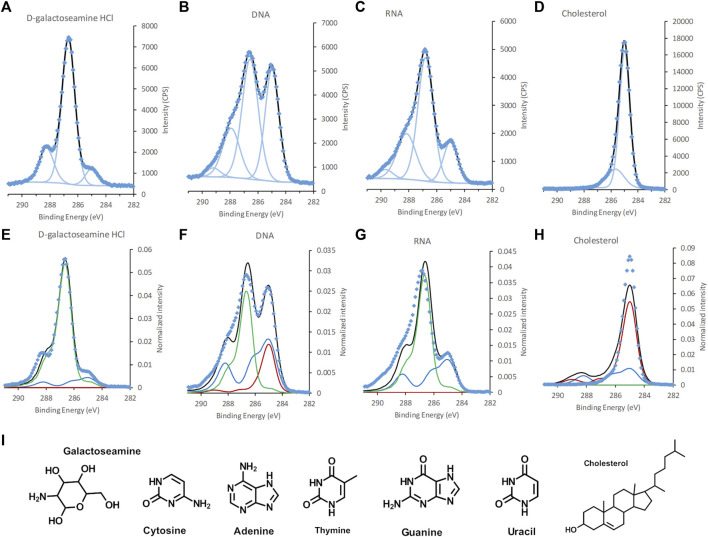
FIGURE 3.
C 1s spectra of, (A,E) galactoseamine, (B,F) DNA, (C,G) RNA, and (D,H) cholesterol, (A–D) standard samples fitted with GL30 peakshapes and (E–H) with spectral components. (I) Chemical structure of galactoseamine, nucleobases in DNA and RNA, and cholesterol. Data is represented by blue diamonds, the fit by a solid black line, GL30 peak shapes are represented by light blue lines in figures (A–D), and in (E–F) the blue line represents protein-like substance, green line polysaccharides and red line lipid-like substances.

