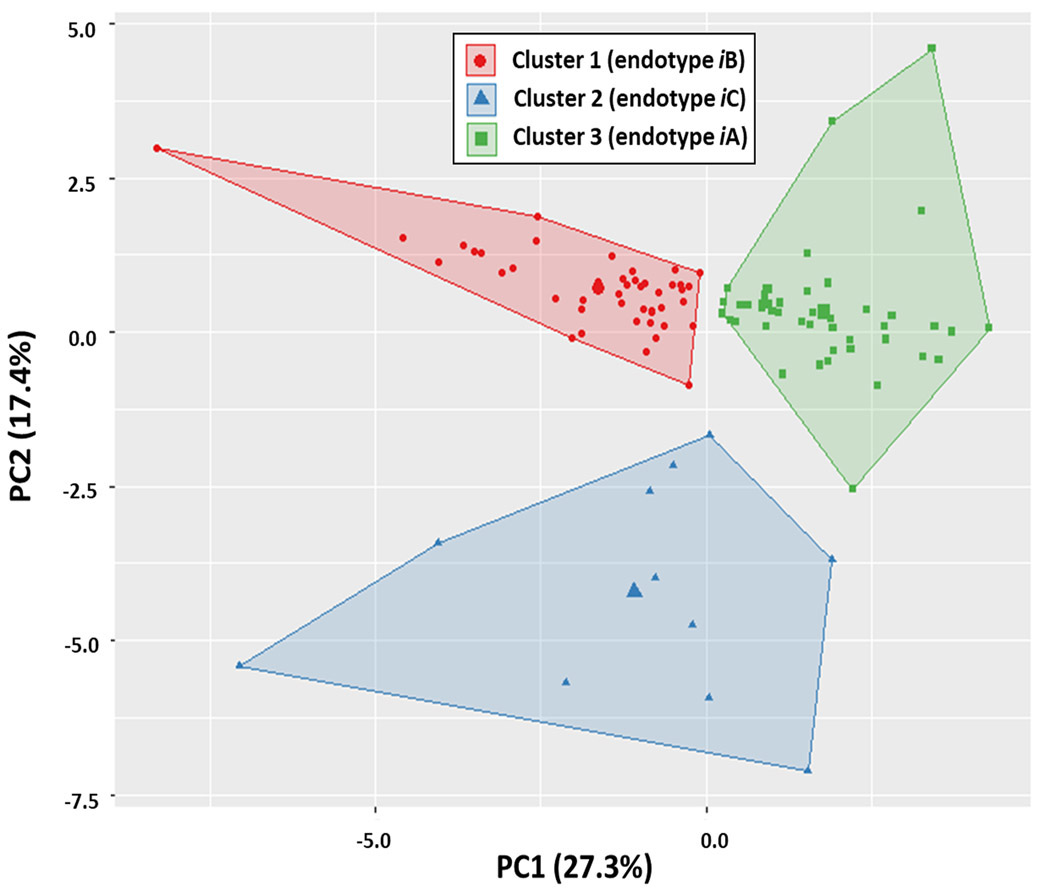
Figure 1. Principle component analysis of cluster endotypes.
Results of 3-group cluster analysis defining endotypes iA (n=47), iB (n=44) and iC (n=11). The first two principle components (PC1, PC2) are defined as X and Y-axes of the two-dimension space respectively. The fraction of the variance explained by a principal component to the total variance is shown for PC1 (27.3%) and PC2 (17.4%). Clustering results and endotype assignment of each data point are labeled and shown in the figure key. K-means clustering centroids are also visualized for each cluster.

