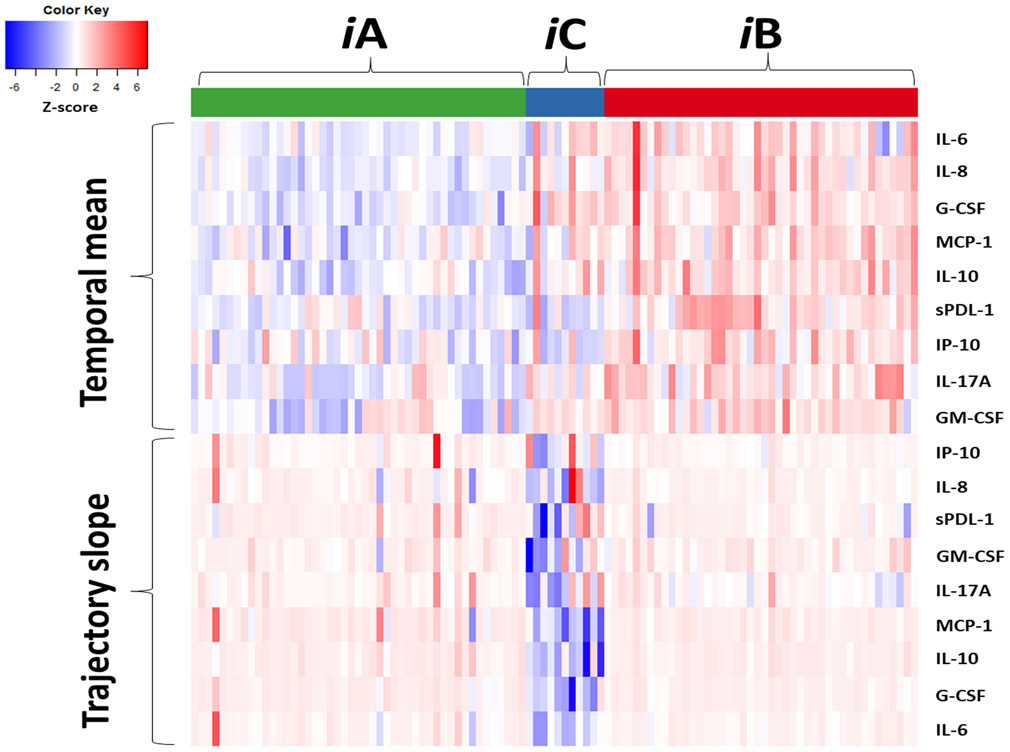
Figure 3. Immune endotype biomarker heatmap.
Heatmap of biomarker temporal mean and trajectory slope, grouped by endotype (iA, iB, iC). Individual subjects are represented by column and biomarkers by row. Temporal mean and trajectory slope values are calculated based on the log-transformed biomarker measurements and then standardized as Z-scores, with white cell color representing the cohort mean, red spectrum above cohort mean and blue spectrum below cohort mean.

