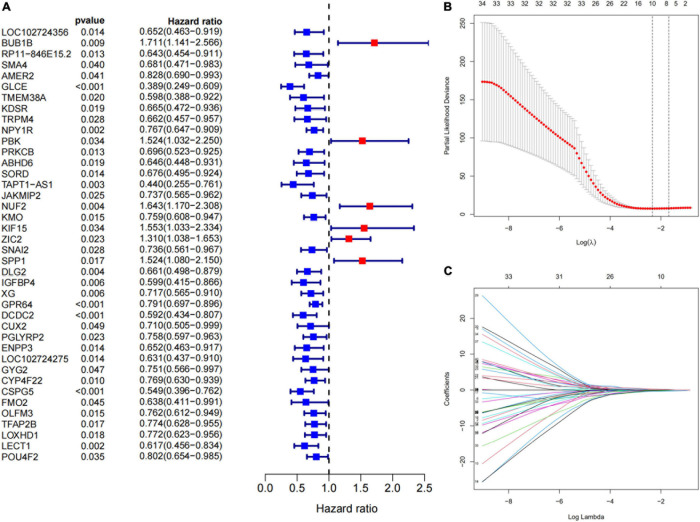
FIGURE 5.
Construction of immune-related genes prognostic signature. (A) The p-value and HR of selected genes in univariable Cox regression analysis (p < 0.05). (B) The LASSO regression identified 10 genes associated with prognosis. The partial likelihood deviance plot presented the minimum number corresponds to the covariates used for LASSO Cox analysis. (C) A coefficient profile plot was generated against the log (lambda) sequence. Selection of the optimal parameter (lambda) in the LASSO model for GEO cohort.

