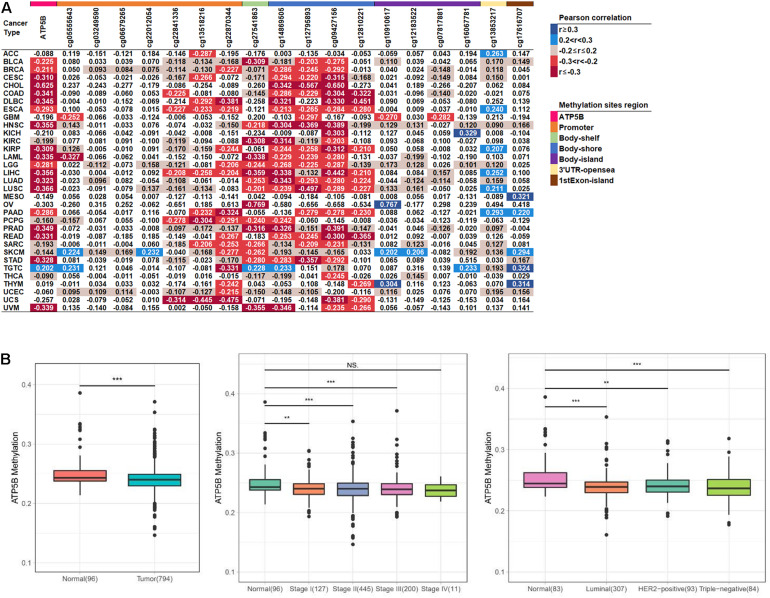
FIGURE 2.
The methylation level analysis of ATP5B in the TCGA datasets. (A) Correlation between methylation levels and mRNA expression of ATP5B and its 18 methylation sites across 33 TCGA cancer types. The number represents the Pearson correlation r-value, and all statistically significant r-values are graded and colored (right legend, p < 0.05). (B) The ATP5B methylation level in the TCGA breast cancer dataset compared with normal tissues, stages I–IV and the three molecular subtypes. Boxplots represent the median with the interquartile range.

