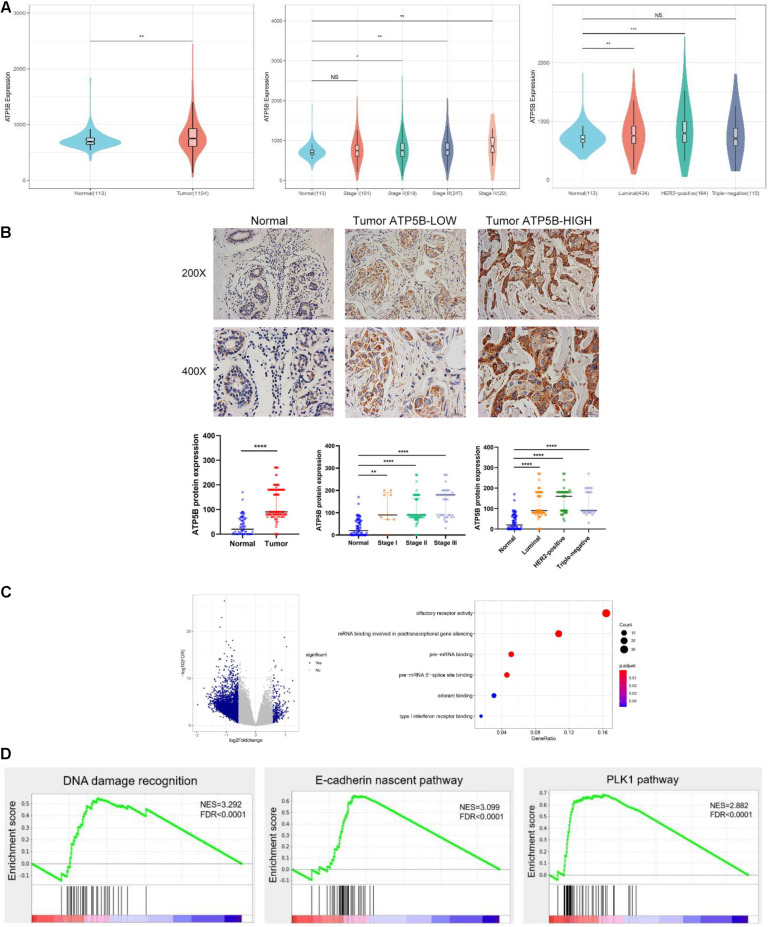
FIGURE 3.
ATP5B expression and functional enrichment in breast cancer. (A) Comparison of ATP5B mRNA expression between tumors and normal tissues, stages I–IV, and each subtype, including luminal, HER2 positive, and triple-negative cancers, in the TCGA BRCA data. (B) Representative IHC staining of the control, low and high expression of ATP5B protein in breast cancer; scale bar, 20 μm. The relative protein level of ATP5B in breast cancer tissues compared with adjacent normal tissue, stages I–III, as well as the three molecular subtypes. The data represent the median with interquartile range. (C) Volcano plot of differentially expression gene profiles between the ATP5B-high and ATP5B-low groups. The cut-off points were set at |log2(fold change)| ≥ 1.5 and FDR < 0.05. GO annotation analysis of the overlapping genes in molecular function. Each circle represents a term, and its size represents the counts of the involved genes. (D) The three enrichment plots from the GSEA, including DNA damage recognition, E-cadherin nascent pathway and the PLK1 pathway.

