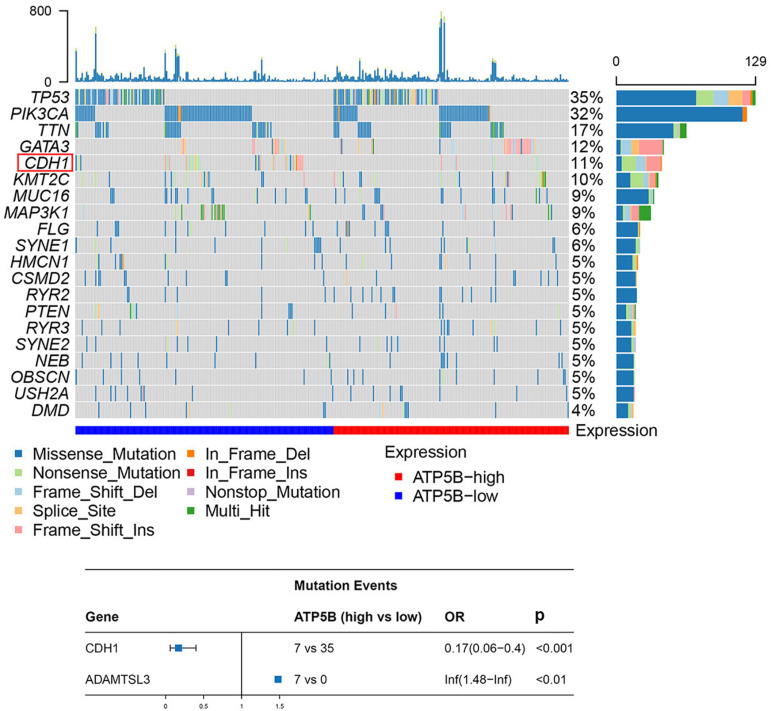
FIGURE 5.
Mutation analysis of ATP5B. The top 20 mutated genes in the breast cancer subsets stratified by ATP5B expression. The red frame represents the mutation with a statistically significant difference (p < 0.05). At the bottom is a forest plot of significantly mutated genes. Consider only genes with at least three samples mutated in one of the cohort for analysis.

