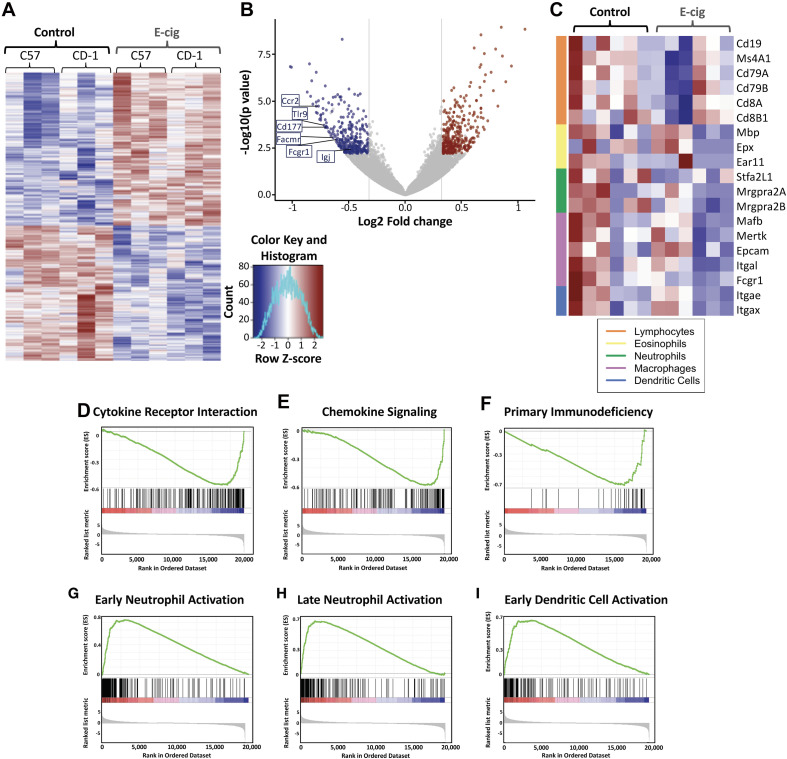
FIGURE 1.
Exposure to e-cigarette aerosol induces profound effects in overall inflammatory responses in two different mouse genetic backgrounds. Transcriptomic analysis of lung tissue performed by RNAseq from CD1 and C57BL/6 female mice exposed daily to e-cigarette aerosol generated by Vape pens with 50:50 PG:Gly and 24 mg/ml nicotine for 3 and 6 months, respectively, detected 2,818 (CD1) and 2,933 (C57BL/6) gene expression changes. (A) Heat map of differentially expressed (fold change of 1.25 and adjusted p-value less than 0.1) genes with hierarchical clustering revealed many genes with expression changes in both strains of mice after e-cigarette exposure as compared to Air controls. (B) Examination of gene expression changes above 1.5-fold (vertical lines) by volcano plot revealed several genes of interest. Igj was greatly reduced, indicating that e-cigs substantially impair lung IgA expression. CD177, Facmr, Tlr9, Fcgr1, and Ccr2 were reduced, indicating a further loss of host defenses. (C) Assessing immune cellspecific gene expression changes in the lung tissue demonstrated alterations across lymphocytes, eosinophils, neutrophils, macrophages and dendritic cells. Enrichment plots demonstrated profound downregulation of gene expression in broad immune signaling (D,E) pathways, important for (D) cytokine receptor interactions and (E) chemokine signaling. (F) Downregulation across genes of importance in primary immunodeficiency was seen, while patterns of gene upregulation were detected in innate immune cells: (G) Early neutrophil activation and (H) Late neutrophil activation, and cells that act as the intersection between innate immune and adaptive cells – antigen presenting cells: (I) Early dendritic cell activation. Data is representative of 6 mice per group, with total lung RNA from pairs of mice pooled, giving three data points per group. The enrichment score is shown as a green line (D–I), which reflects the degree to which a gene set (the barcode where each black line is a gene in the gene set) is overrepresented at the top or bottom of a ranked list of genes (the heatmap axis – red/blue/white).

