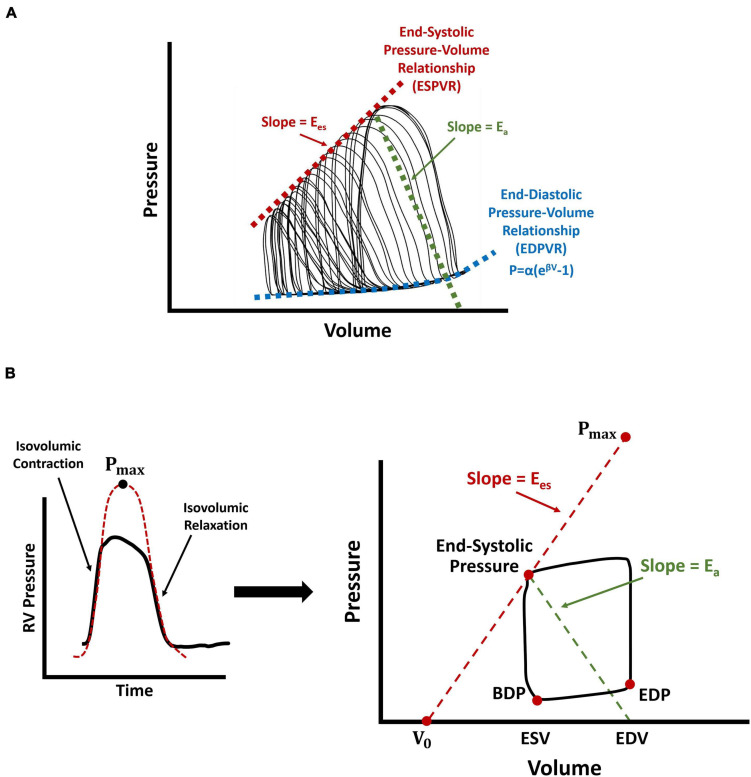
FIGURE 3.
Schematic demonstration of different measurement techniques for characterization of RV end-systolic elastance, end-diastolic pressure-volume relationship (EDPVR), and RV-PA coupling efficiency. (A) RV preload reduction via vena caval occlusions in animal models, resulting in multiple P-V loops. (B) Single-beat estimation of RV end-systolic elastance using the “pressure method”, where Pmax is characterized by the amplitude of a sinusoidal fit to the isovolumic contraction and relaxation portions of RV pressure waveforms. Here, V0 represents the volume axis intercept of the line between Pmax and the end-systolic point of the P-V loop. RV-PA coupling efficiency is calculated using the ratio of . Arrows show RV end-systolic elastance (red; Ees), PA elastance (green; Ea), and the nonlinear fit to the EDPVR (blue). For the equation used to fit the EDPVR, β represents the diastolic stiffness, α is a scaling factor, and P and V are respectively, end-diastolic pressure and volume data. RV: Right ventricle; PA: Pulmonary artery; P-V loop: Pressure-volume loop; BDP: Beginning-diastolic point; EDP: End-diastolic point; ESV: End-systolic volume; EDV: End-diastolic volume; EDPVR: End-diastolic pressure-volume relationship.

