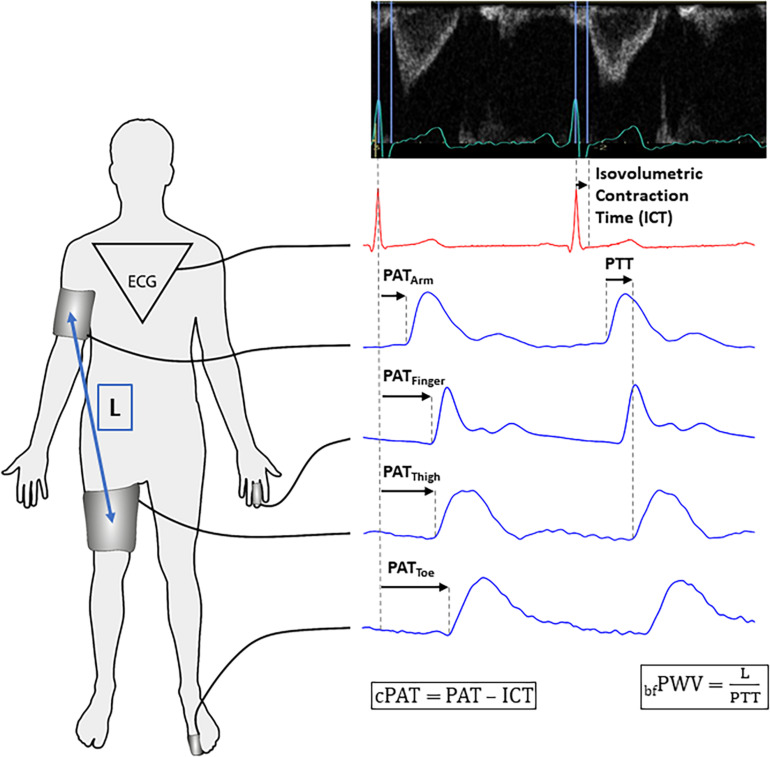
FIGURE 2.
Data acquisition for vascular measurements. Left panel: Recording sites and length (L) determination for brachial-femoral pulse wave velocity (bfPWV) assessment. Right panel – top: ECG and Doppler flow curves in the left ventricular outflow tract. We measured isovolumetric contraction time (ICT) from the R-peak to aortic valve opening indicated by flow onset. Right panel – bottom: Pulse wave arrival time (PAT) is defined as the time from the ECG R-Peak to pulse wave arrival at a certain landmark. By dividing L by pulse transit time (PTT) between arm and thigh cuffs, we obtained bfPWV. We obtained measurements from every heartbeat recorded during a 60-s period. For the sake of clarity, PAT and PTT are shown for two consecutive heart beats. We calculated corrected PAT (cPAT) by subtracting ICT from PAT.

