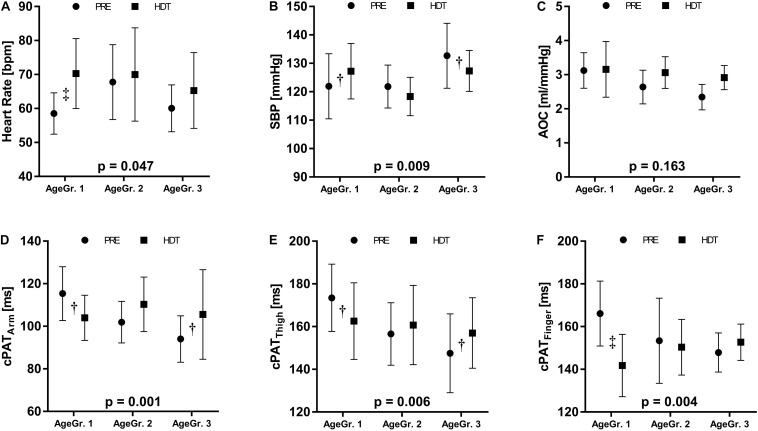
FIGURE 5.
Exploratory analysis relating the HDTBR response to age. We stratified participants in three age groups (AgeGr.): AgeGr. 1 = 24–27 years; AgeGr. 2 = 29–36 years, and AgeGr. 3 = 37–55 years. (A) heart rate, (B) systolic blood pressure (SBP), (C) aortic compliance (AOC), and corrected pulse wave arrival times to the (D) arm (cPATArm), (E) thigh (cPATThigh), and (F) finger (cPATFinger). The p-values indicate the interaction between AgeGr. and bed rest. Results are represented as mean values ± standard deviation from base line recordings (PRE, dot symbol) and HDT (square symbol). Significant difference between these time points is indicated by †(p < 0.05) and ‡(p < 0.001).

