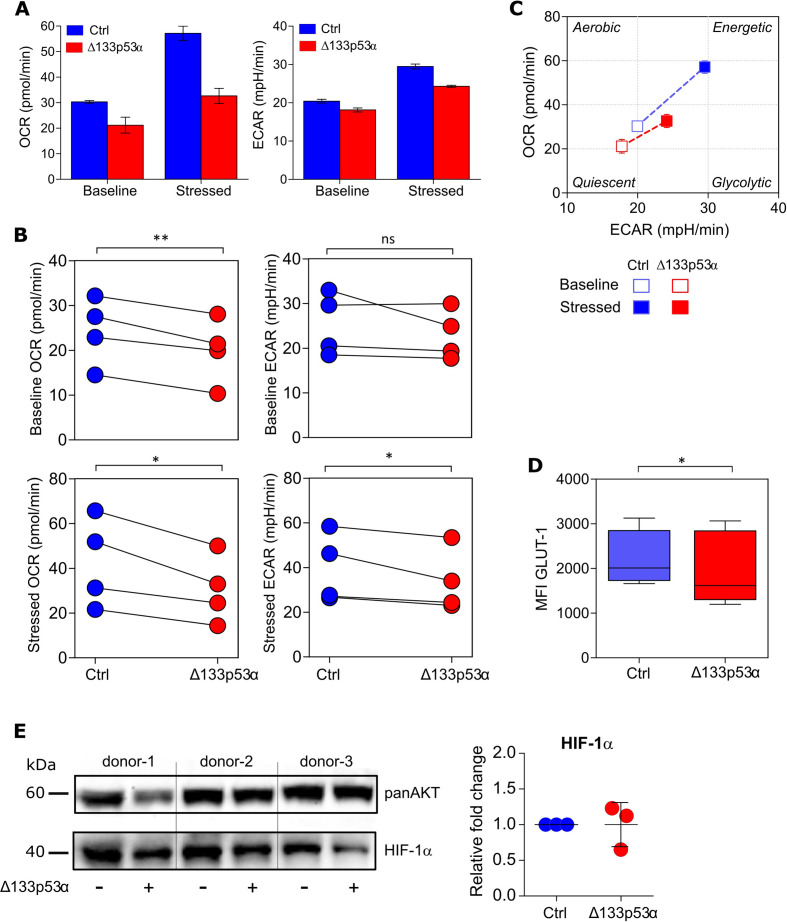
Figure 2.
Δ133p53α dictates metabolic reprogramming in T cells. (A) Oxygen consumption rate (OCR, left figure) and extracellular acidification rate (ECAR, right figure) of Δ133p53α-transduced and control cells before (Baseline) and after (Stressed) addition of oligomycin and FCCP measured with a XFp Extracellular Flux Analyzer. Representative of n=4 biological replicates, shown as mean±SEM. (B). Dot plots depicting OCR and ECAR measures for paired samples of Δ133p53α-modified or control T cells from four healthy donors. (C) Energy Phenotype Profile of indicated cells demonstrating the relative utilization of glycolysis and mitochondrial respiration. (D) Box plots showing the expression level (as mean fluorescence intensity, MFI) of glucose transporter 1 (GLUT1) in control and Δ133p53α-transduced cells (n≥5). (E) Protein expression of HIF-1a in engineered CD8+ T cells from three healthy donors. Immunoblot (left) and dot plots (right) showing the fold change expression in Δ133p53α-modified as compared with control T cells. Analysis of the metabolic activity, including the expression of GLUT1 and HIF-1a were carried out early stage (1–3 weeks) after transduction. Error bars indicate SE of mean (SEM). *P<0.05, **p<0.01. ns, not significant.

