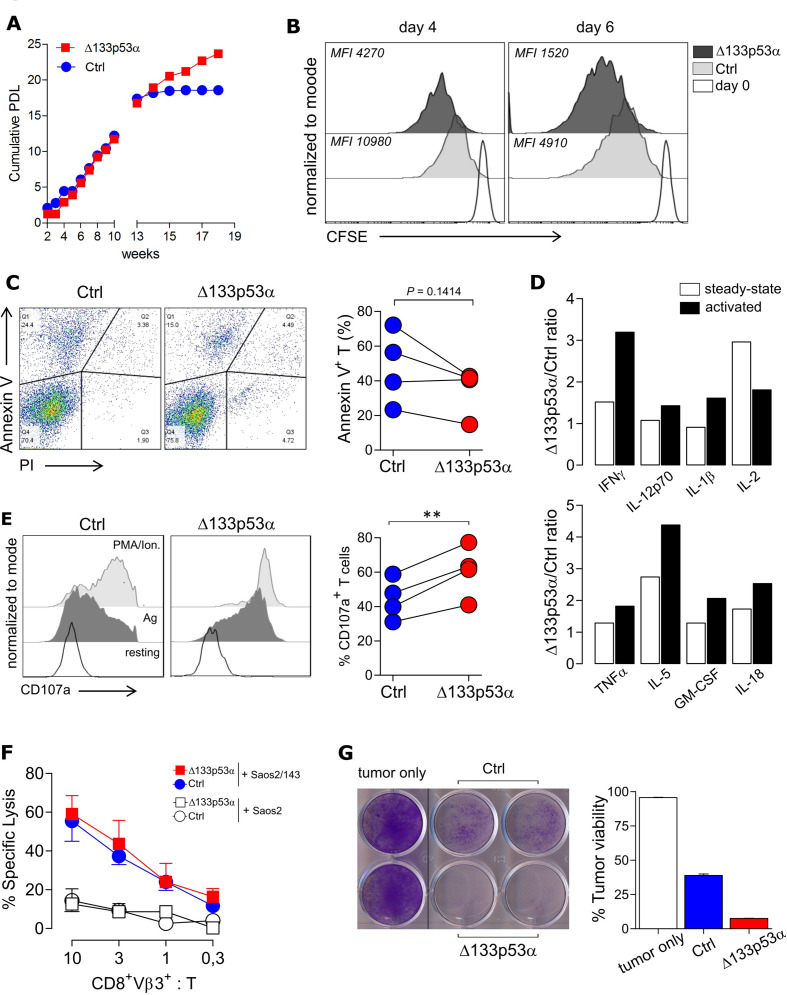
Figure 3.
Δ133p53α invigorates T cell proliferation, cytokine response and improves long-term killing potential of antigen TCR-engineered T cells. (A) Cumulative PDL of control and Δ133p53α-transduced T cells over time from a representative donor. (B) CFSE proliferation assay of control and Δ133p53α-overexpressing T cells after several weeks of in vitro culture. Y-axis indicates the reduction of intracellular CFSE on Day 4 (left plot) and Day 6 (right plot) after antigen-specific stimulation (Day 0) and was normalized to mode. (C) Representative flow plots of the apoptosis marker Annexin V and Propidium Iodide (PI) for control and Δ133p53α-transduced T cells. Summary results are depicted as paired dot plots for each individual biological replicate (n=4). (D) Fold change of secreted cytokines from Δ133p53α-overexpressing to control cells under resting and activated conditions measured by Multiplex Immunoassay at late stage in vitro culture. For activation, T cells were cultured over 24 hours with target tumor cells Saos2/143 (E:T=1:1) (n=2 biological replicates). (E) Degranulation Assay of control and Δ133p53α-overexpressing T cells again under steady-state (=resting) and activated conditions (Ag=antigen-specific stimulation) at the same time point. Stimulation with PMA/Ionomycin was included as positive control. Degranulation is indicated by cell surface expression of LAMP1/CD107a, assessed by flow cytometry. Dot chart showing the percentage of CD107a+CD8+ T cells for paired samples of Δ133p53α-modified or control T cells from four healthy donors. (F) 51Cr-release Assay and (G) Tumor Colony-Forming Assay were used to evaluate short-term and long-term antitumor responses of Δ133p53α-modified compared with control T cells. For 51Cr-release assay-specific lysis of target (Saos2/143) and control (Saos2p53null) tumor cells is illustrated at the indicated effector to target ratio (CD8+Vβ3+:T). Tumor colony-forming assays were performed over 24 hours per round with an effector to target ratio (CD8+Vβ3+:T) of 1:1. Remaining tumor colonies were labeled with crystal violet dye. Quantification was performed by measuring the optical density (OD) of the residual dye, and values expressed as per cent of tumor viability. One representative experiment out of four biological replicates is shown. **P<0.01. CFSE, carboxyfluorescein succinimidyl ester; E:T, effector-to-target; IFNγ, interferon-γ; IL, interleukin; GM-CSF, Granulocyte-macrophage colony-stimulating factor; MFI, mean fluorescence intensity; TNFα, tumor necrosis factor-α.

