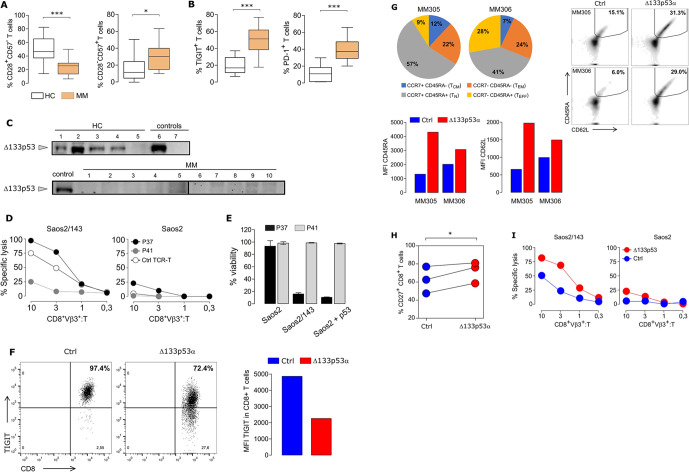
Figure 7.
Reverting senescence in multiple myeloma (MM) patient T cells by Δ133p53α gene transfer. (A) Reduced frequency of CD8+CD28+CD57- (left, p=0.0014) and increased frequency of CD8+CD28-CD57+ (right, p=0.0461) T cells from MM patients (n=10) compared with healthy donor T cells (HC, n=15). (B) T cells from MM patients (n=27) revealed high levels of TIGIT and PD-1 expression compared with healthy donor T cells (HC, n=7–15) (p<0.0001). (C) Western Blot showing protein expression of Δ133p53α in T cells from MM patients and healthy controls (HC). Δ133p53α-transduced T cells and Saos2p53null (lane 6–7) served as positive and negative controls. Total protein loaded per lane was 32–60 µg for HC and MM samples. (D) Short-term and (E) Long-term Killing Assays comparing T cells from two MM patients with low TIGIT expression (P37, CD8+TIGIT+: 21%) and high TIGIT expression (P41, CD8+TIGIT+: 77%). (F) Overexpression of Δ133p53α in T cells from a MM patient (MM305) resulted in reduced frequency of TIGIT-expressing T cells (flow plota) and lower expression levels (MFI plot). (G) Phenotype of CD8+T cells from two myeloma patients (MM305, MM306) prior (pie chart, left) and after (flow plots, right) retroviral transduction with ctrl or Δ133p53α. Expression intensity of CD45RA and CD62L expression in CD8+ engineered T cells are shown as MFI plots. (H) Dot chart showing the percentage of CD27+CD8+ T cells for paired samples of Δ133p53α-modified or control T cells from three MM patients. (I) Short-term Killing Assays of T cells from the same patient (MM305) transduced with Δ133p53α or control vector exhibited an improved cytolytic response by Δ133p53α-overexpression at different effector (CD8+Vβ3+) to target (T) ratios. Error bars indicate SE of mean (SEM). *P<0.05, ***p<0.001, by two-tailed Student’s t-test. MFI, mean fluorescence intensity; PD-1, programmed cell death 1; TCR, T cell-receptor.

