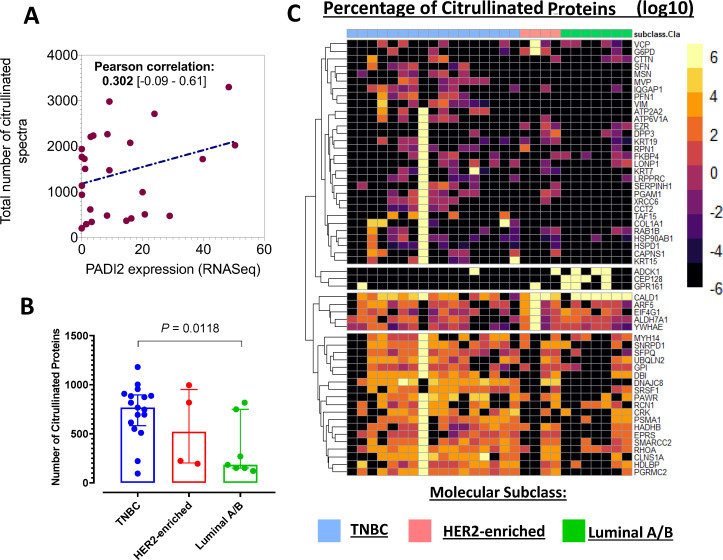
Figure 2.
Hormone receptor specificity of citrullinome in breast cancer cell lines. (A) Scatter plot illustrating the correlation (Pearson correlation, 95% CI) between the total number of citrullinated mass spectra and PADI2 mRNA expression in breast cancer cell lines. (B) Distribution plots illustrating the number of citrullinated proteins in whole cell lysates of breast cancer cell lines stratified by hormone receptor positivity. Statistical significance was determined using Wilcoxon rank-sum test. (C) Heatmap of whole cell lysate citrullinome. Unsupervised heatmaps illustrate the percentage of differentially expressed citrullinated proteins across the hormone receptor subtypes (one-way analysis of variance, two-sided p<0.05). mRNA, messenger RNA; PADI, protein arginine deiminase; TNBC, Triple Negative Breast Cancer.

