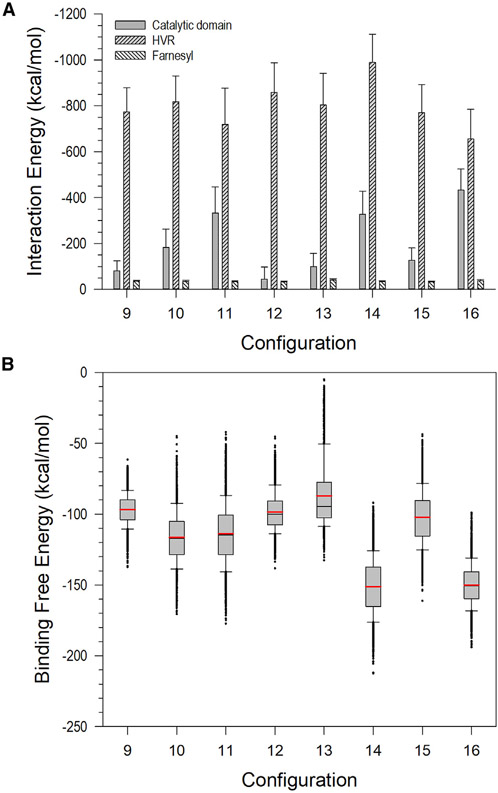
Figure 5. Interaction Energy and Binding Free Energy.
(A) Averaged interaction energies of the catalytic domain, HVR, and farnesyl of FME KRas4B1-185 with CaM. Error bars indicate standard deviation.
(B) Binding free energy for the FME KRas4B1-185 interaction with CaM. In the calculation, gas phase contribution, the solvation energy contribution, and the entropic contribution combines the average binding free energy. In the box graphs, the red and black lines denote the mean and median values, respectively. Whiskers above and below the box denote the 90th and 10th percentiles.

