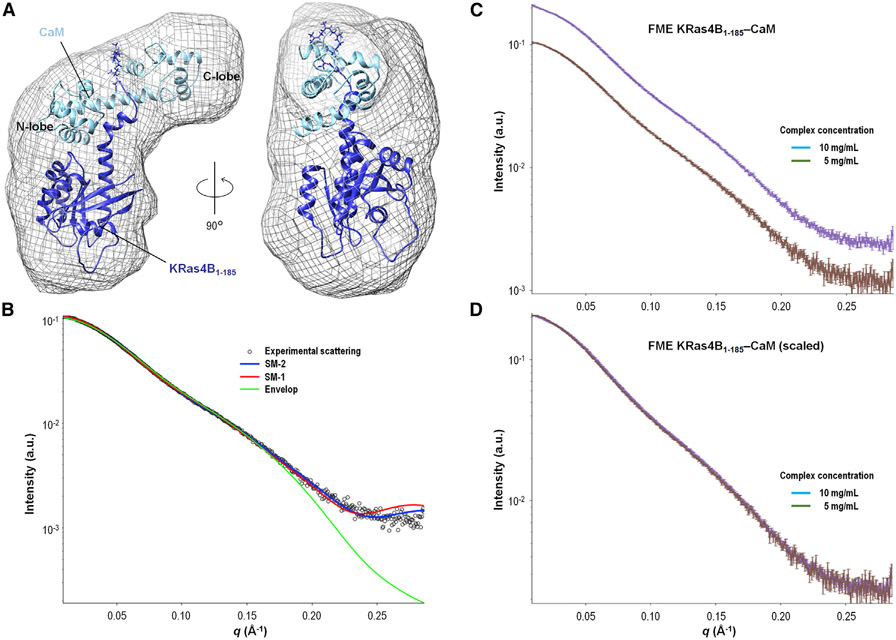
Figure 6. SAXS Model 2 of KRas4B-CaM Complex.
(A) Proposed SAXS model 2 (SM-2) of the KRas4B1-185-CaM complex. An averaged ab initio model constructed from the SAXS data is superimposed with the proposed model of FME KRas4B1-185-GppNHp (dark blue) in complex with CaM (light blue).
(B) The SAXS data (open circles) are plotted with the theoretical scattering curves of the envelope (green), SM-1 (red), and SM-2 (blue). The fit of SM-2 (χ2 = 1.84) against the experimental data is significantly better than those for SM-1 (χ2 = 2.14) or the envelope (χ2 > 3).
(C) The SAXS data are plotted with explicit error for two concentrations of FME KRas4B1-185-CaM samples (5 mg/mL, brown, and 10 mg/mL, purple). The experimental scattering curves between the two samples are nearly identical.
(D) The SAXS of the two samples are plotted, with a scaling factor of 1.98 applied to the 5 mg/mL data. The scaling of the 5 mg/mL data by a factor of nearly 2 for optimal alignment with the 10 mg/mL scattering curve suggests that the concentrations of the complexes were correctly characterized, with no protein aggregation. The two curves superimpose well with the same features, indicating that the two samples contain the same species.

