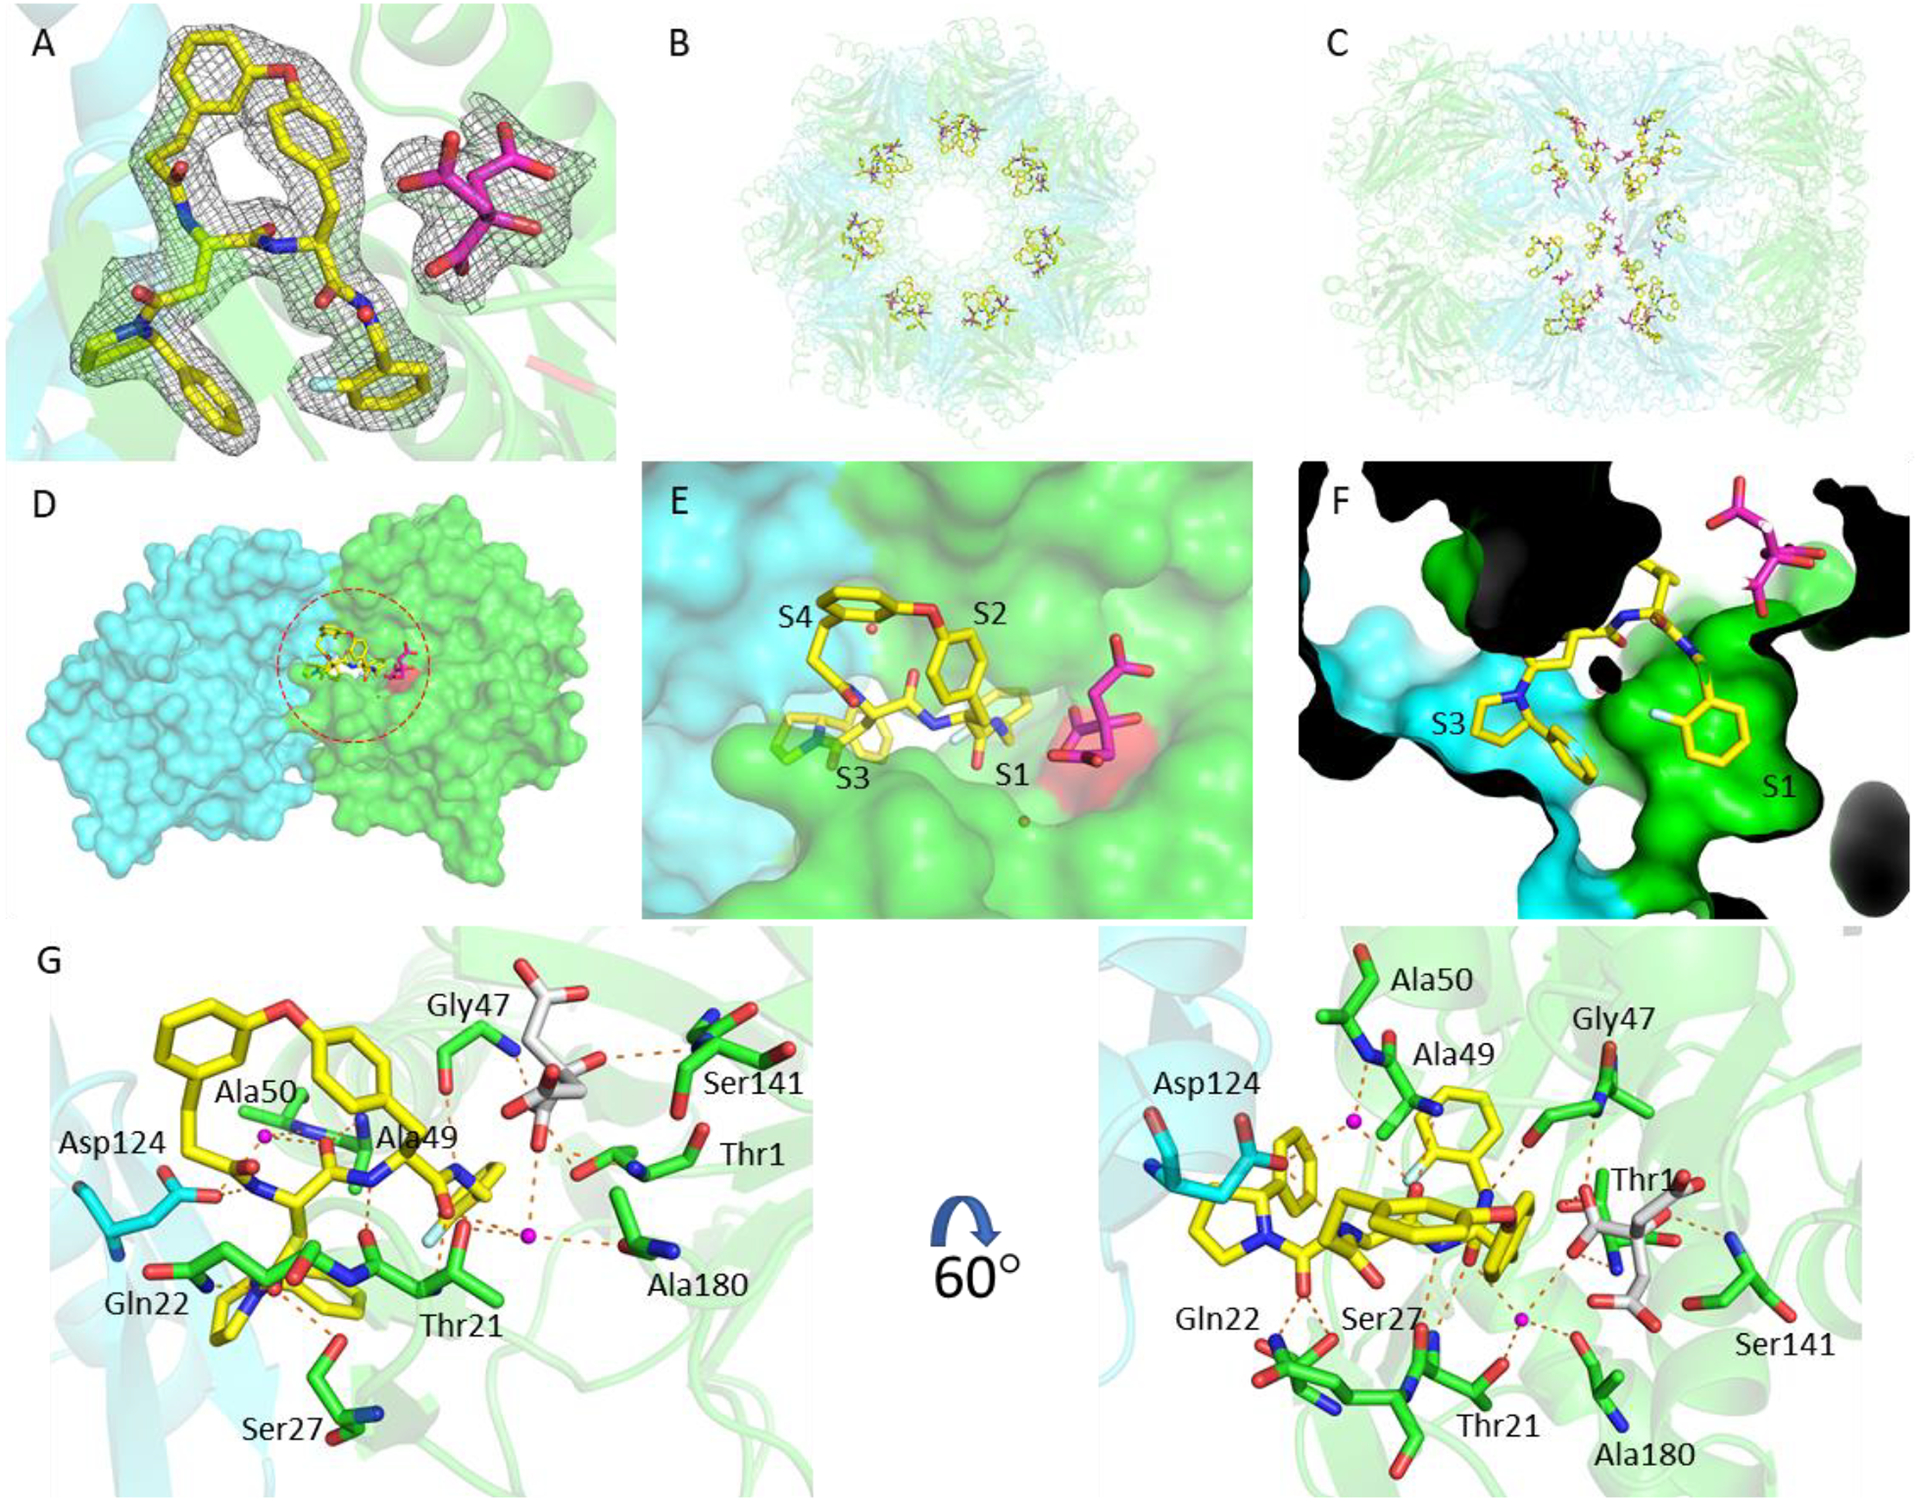
Figure 5.

The binding mode of macrocycle 6 in the Mtb20SOG active site. A) The 2mFo–DFc electron density map is rendered at 1σ threshold and shown as gray meshes. Macrocycle 6 is in yellow and the citrate from solvent in magenta sticks. The two neighboring β-subunits are in green and cyan, respectively, and the catalytic residue Thr-1 is in red. B-C) A top and a side view of the Mtb20S structure, highlighting the 14 macrocycle 6 molecules in the active sites of the 14 catalytic β-subunits. D) A surface view of two neighboring β-subunits (green and cyan) as viewed from the interior chamber, demonstrating that the inhibitor in the substrate pocket of the green subunit also contacts the cyan subunit. E) A close-up view of the inhibitor-bound active site. F) P1 and P3 are inserted into the S1 and S3 binding pockets, respectively. G) The binding mode of macrocycle 6 in Mtb20SOG. Hydrogen bonds between macrocycle 6 and the β-subunits are shown as dashed orange lines. The two neighboring β-subunits are in green and cyan; water molecules are shown as magenta spheres; and citrate is in gray sticks.
