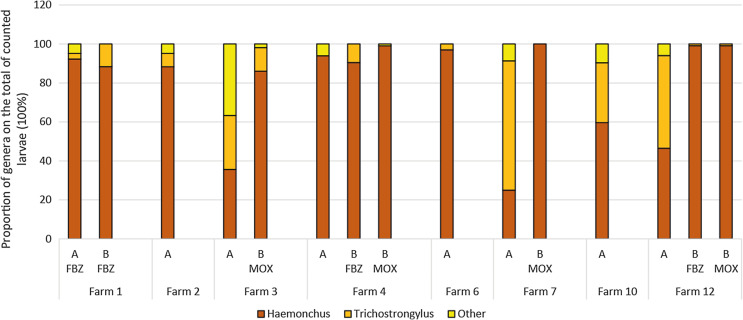
Figure 1.
Results of larval differentiation in study 1 shown as proportions of different genera. Each column represents 100% of counted larvae. A = before treatment (pooled samples of whole farm), B = after treatment (pooled samples of the respective treatment group). Other = Teladorsagia, Chabertia, Oesophagostomum.

