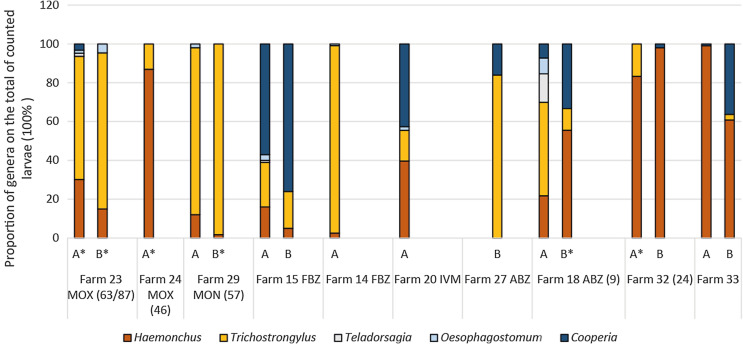
Figure 2.
Results of larval differentiation in study 2 shown as proportion of different genera. Each column represents 100% of counted larvae. A = before treatment (pooled samples of whole farm), B = after treatment (pooled samples of the respective treatment group). If less than 100 larvae were differentiated, this is marked by an asterisk, and number of larvae that were differentiated is given in brackets.

