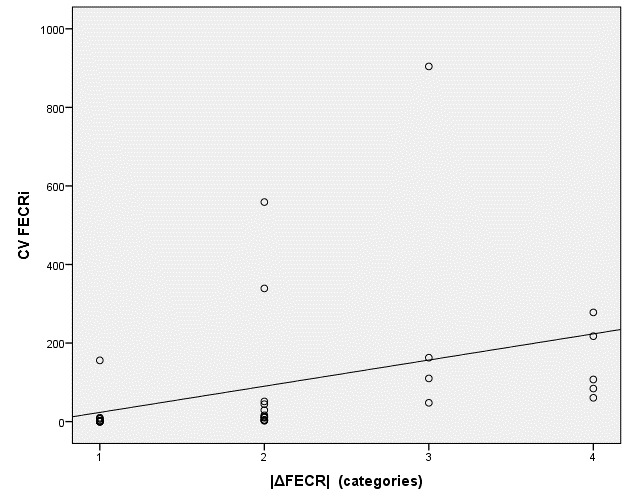
Supplementary Figure 1.

Scatter plot of the coefficient of variation of individual egg count reduction on farms (CV FECRi) plotted against the difference between the two calculation standards of eggCounts (|ΔFECR|-categories). Categorisation: 1 = Δ0; 2 = Δ1–5; 3 = Δ6–10; 4 = Δ > 10.
