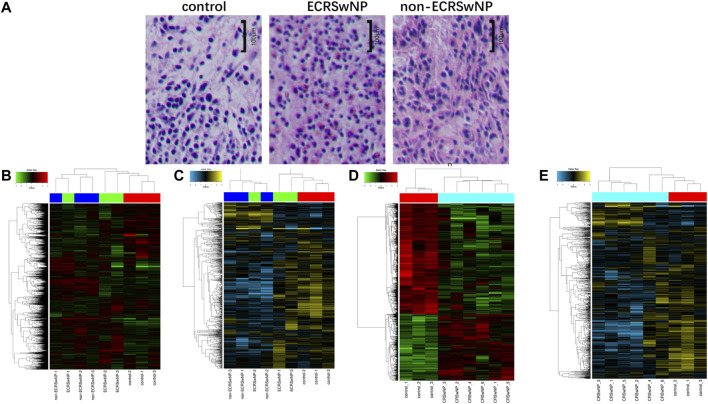
FIGURE 1.
Hematoxylin-eosin staining of control, ECRSwNP, and non-ECRSwNP groups, and differential expression of circRNAs and miRNAs in the three groups. (A) Representative images of hematoxylin-eosin staining. The scale bar represents 100 μm. (B) Hierarchical clustering analysis heat map showing significantly changed of circRNAs and (C) of miRNAs with fold change ≥2.0 (p < 0.05) in the three groups (ECRSwNP, non-ECRSwNP, and control). The expressions of circRNAs and miRNAs were significantly different between CRSwNP and control groups, but ECRSwNP and non-ECRSwNP groups shared similar gene expression profiles. Then, they were combined as the CRSwNP group. Hierarchical clustering analysis heat map showing significantly changed of circRNAs (D) and of miRNAs (E) with fold change ≥2.0 (p < 0.05) in the two groups (CRSwNP and control).

