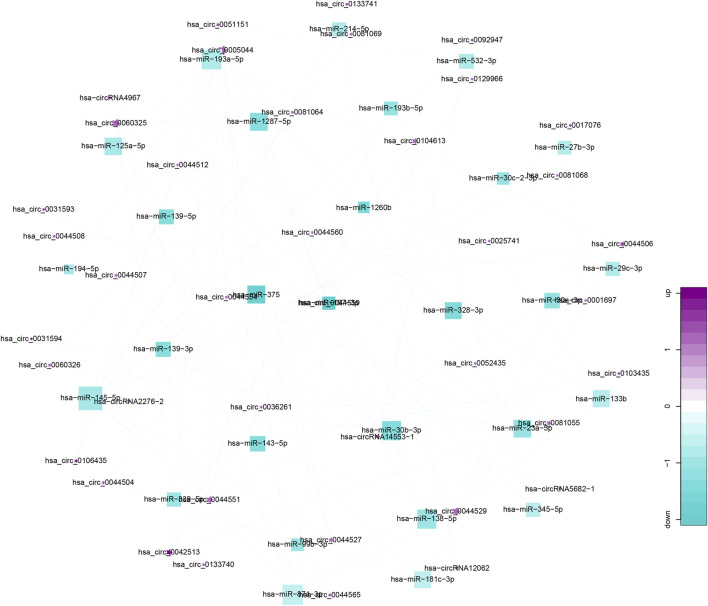
FIGURE 3.
Top 40 circRNA-miRNA co-expression networks. Co-expression networks were analyzed by miRanda-3.3 software, combined with entropy values below 20. Stars represent circRNAs; squares represent miRNA; lines represent correlative relationships. Different sizes and colors represent the corresponding (up/down) relationship.

