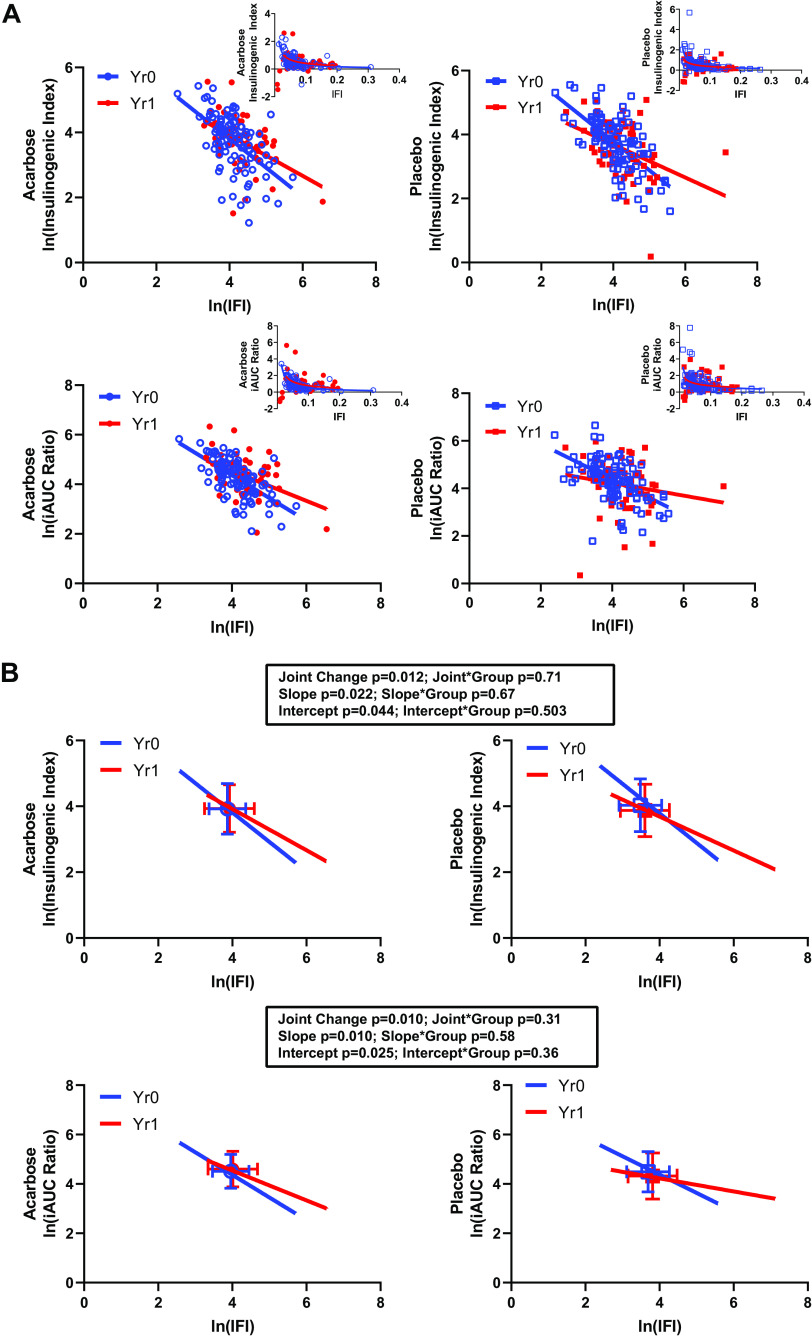
Figure 1.
OGTT-derived insulin secretion–sensitivity relationships. A: presents the raw data for the linearized relationships, together with overlaid fitted lines. The inserts present the untransformed data and fitted lines. The underlying data were in units of mU · mL−1 · mg−1 · dL (IGI, insulinogenic index; top), iAUCins/iAUCgluc µU · mL−1 · mg−1 · dL (iAUC ratio; incremental area under the curve for insulin over incremental area under the curve for glucose; bottom), and mL · μU−1 (IFI, inverse fasting insulin). Natural logarithmic transformations were applied as described in methods. Data for each treatment group are presented separately for clarity. B: presents the fitted lines for the linearized relationships, together with the summary results for each set of analyses. The box and whiskers represent the x–y means ± SD for each set of data points. Analyses are presented showing the effect of time on the secretion-sensitivity relationship (joint change), on the slope, and on the intercept of each underlying pair. The effect of treatment group is presented as an interaction term for each of these factors. OGTT = oral glucose tolerance testing.

