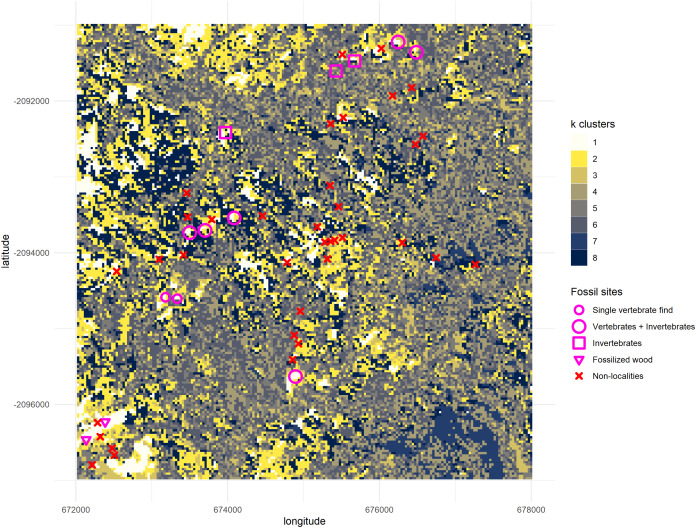
Figure 5. Output from the k-means algorithm for data mining.
All geolocations “Vertebrates + Invertebrates” and “Invertebrates” recorded by the PaleoPrimate Project Gorongosa team during 2016 and 2017 (Habermann et al., 2019) are plotted over the clusters, as well as the “Single vertebrate find” and “Fossilized wood” localities reported by Pickford (2012, 2013). You can see the cluster 1 (white) tends to be represented in locations with fossil vertebrates, indicating that it has some potential as a new feature/variable for finding new fossil sites. The map displays a 6 by 6 km square; axes scales are in meters.

