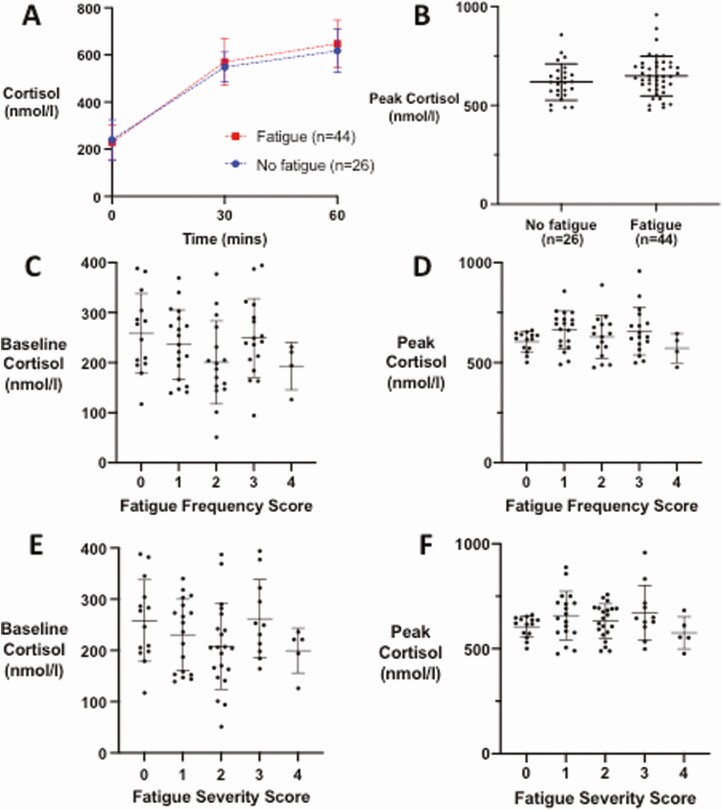
Figure 4.
Serum cortisol response to 250 µg Synacthen in patients 3 months after COVID-19 with persistent fatigue (n = 44) compared with those without (n = 26). (A) Mean (error bars show SD) for serum cortisol (nmol/L) at 30 and 60 minutes following Synacthen, comparing patients with persistent fatigue (n = 44, red lines and symbols) vs those with no persistent fatigue (n = 26, blue lines and symbols). (B) Graph of peak serum cortisol in patients with persistent fatigue and those without persistent fatigue. Individual data points plotted with horizontal line representing mean, whiskers represent SD. (C) Graph of baseline cortisol in groups classified by tiredness frequency graded 0 (not present), 1 (present a little of the time), 2 (present about half of the time), 3 (present most of the time), 4 (present all of the time). (D) Graph of peak cortisol in groups classified by tiredness frequency graded 0 (not present), 1 (present a little of the time), 2 (present about half of the time), 3 (present most of the time), 4 (present all of the time). (E) Graph of baseline cortisol in groups classified by tiredness severity graded 0 (not present), 1 (mild), 2 (moderate), 3 (severe), 4 (very severe). (F) Graph of peak cortisol (nmol/L) in groups classified by tiredness severity score graded 0 (not present), 1 (mild), 2 (moderate), 3 (severe), 4 (very severe).

