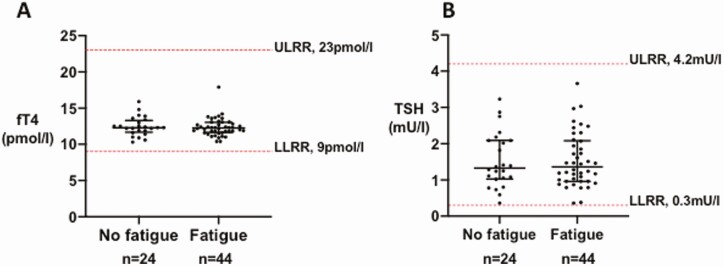
Figure 5.
Thyroid function tests in patients with persistent fatigue. (A) Graph of individual TSH (mU/L) values in patients with fatigue (n = 44) compared with those without (n = 24), in those with no preexisting thyroid disease (n = 68). Individual data points plotted with horizontal line representing median, whiskers represent upper and lower interquartile range (IQR). The normal reference range for TSH using Abbott Architect assay (0.3-4.2 mU/L) is depicted using the red dashed line. Abbreviations: LLRR, lower limit reference range; ULRR, upper limit reference range. (B) Graph of individual fT4 (pmol/L) values in patients with fatigue (n = 44) compared with those without (n = 24) in those with no preexisting thyroid disease (n = 68). Individual data points plotted with horizontal line representing median, whiskers represent upper and lower IQR. The normal reference range for fT4 using Abbott Architect assay (9-23 pmol/L) is depicted using the red dashed line. Abbreviations: LLRR, lower limit reference range; ULRR, upper limit reference range.

