
Figure 2.
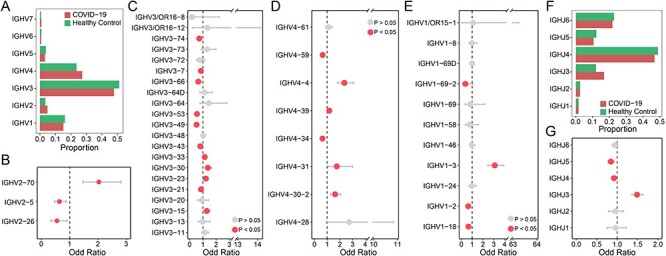
Comparison of variable (V) and joining (J) gene usage in BCR heavy chain between COVID-19 patients and healthy controls. (A) The proportion of each IGHV gene in COVID-19 patients (red) and healthy controls (green). (B–E) The differential analysis of IGHV2 (b), IGHV3(c), IGHV4 (d) and IGHV1 (e) gene family by Fisher’s exact test, the red dots represent P < 0.05 and the grey dots represent P > 0.05. (F) The same barplot as (A) for the IGHJ gene. (G) The differential analysis of IGHJ gene by Fisher’s exact test.