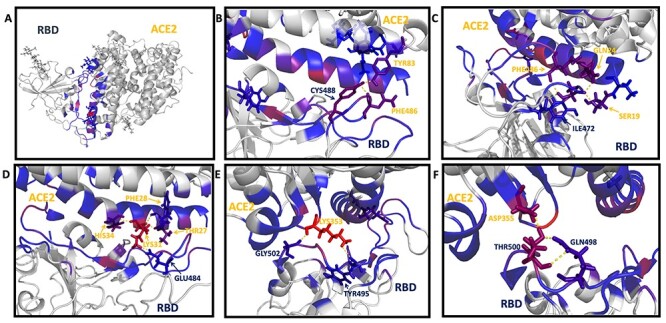
Figure 5 .

The binding hotspot of prototype SARS-CoV-2 RBD with the human ACE2. The binding interface was colored in red and blue to show the interaction strength between the prototype RBD/hACE2 complex. The red color indicates strong interaction; the blue color indicates mild interaction. The grey color indicates no interaction or the negligible interaction. The binding interactions between the interfaces were labeled with residue names. The residues from RBD are labeled in dark blue, and the residues from ACE2 are labeled in yellow. Panel B shows the interaction between Cys488 (RBD), Tyr83 (ACE2) and Phe486. Panel C shows the interaction of Ile472 (RBD) with Gln24 (ACE2), Ser19 (ACE2) and Phe486 (ACE2). Panel D shows the interaction of Glu484 (RBD) with Thr27 (ACE2), Phe28 (ACE2), Lys31 (ACE2) and His34 (ACE2). Panel E shows the interaction of Lys353 (ACE2) with Tyr495 (RBD) and Gly502 (RBD). Panel F shows the interaction of Asp355 (ACE2) with Gln498 (RBD) and Thr500 (RBD).
