
Figure 8 .
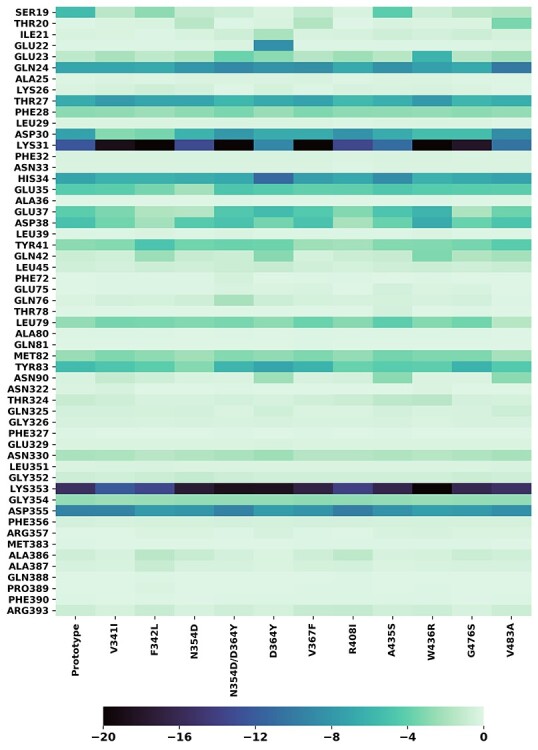
The heatmaps of residues selected from hACE2. The residue was selected if the energy contribution in RBD/hACE2 binding exceeded −0.1 kcal/mol. The y axis label presents the selected residue names; the x axis presents mutant system names. The bar on the bottom represents the relation between energy contribution and the color: darker color on the heatmap indicates bigger contribution in the binding process.