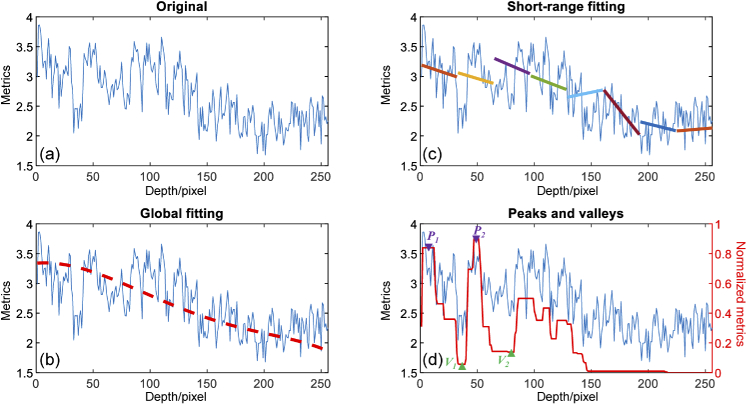
Fig. 2.
A-scan line feature extraction. An original A-scan line data from one image metric is shown in (a). The red dashed line in (b) is the global fitting result after 5th-order polynomial fitting. (c) Short-range linear fitting results in 8 adjacent windows. Peaks and valleys are shown by the red line trace in (d).

