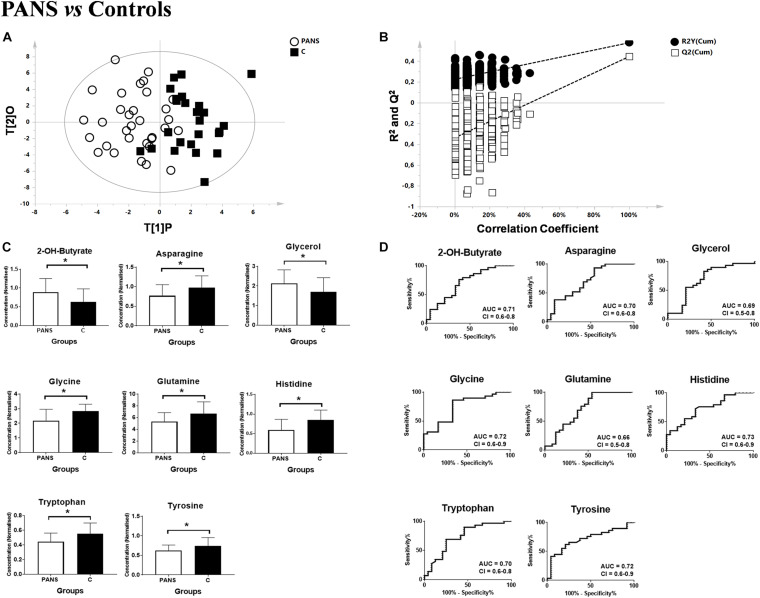
FIGURE 1.
Comparison between PANS and Controls patients. (A,B) OPLS-DA models of the analyzed classes. PANS (white circles) vs. Controls subjects (black boxes) with the respective permutation test. (C) Bar graphs and (D) ROC curves of the metabolites exhibiting a p-value of < 0.05. U-Mann Whitney analysis was used, and subsequently Holm-Bonferroni correction was applied. White bars represent the PANS class while black bars represent the control patients. *p < 0.05.

