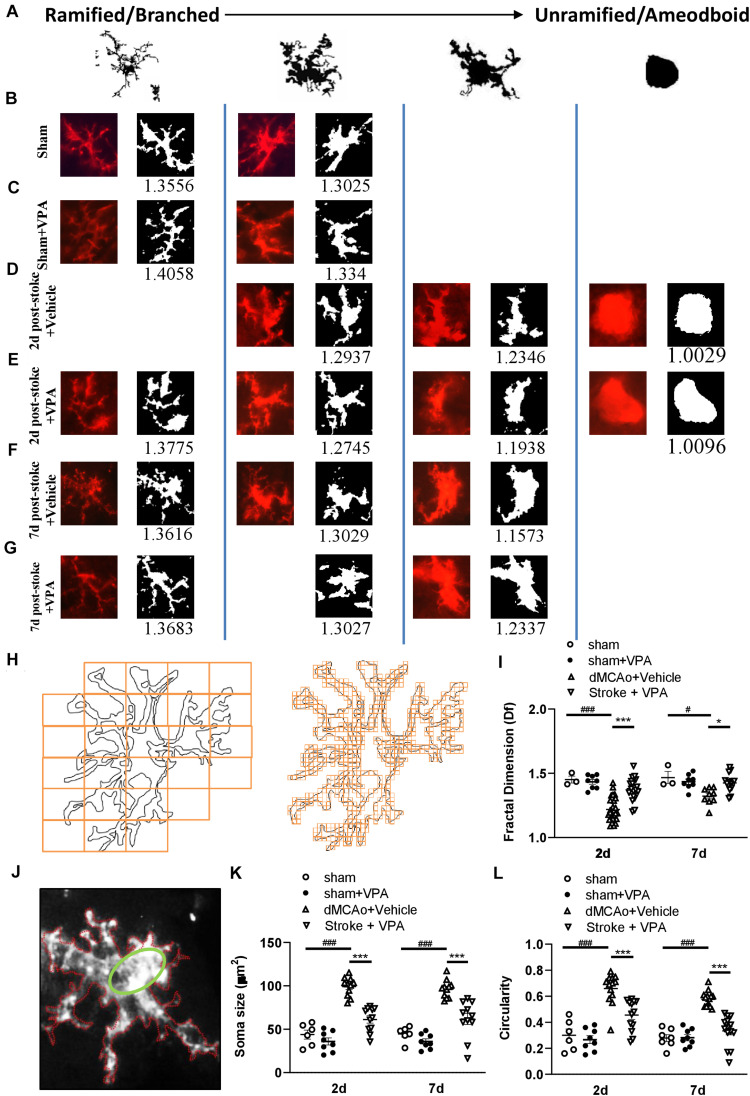
FIGURE 5.
Complexity analysis of CD11b-positive cell morphologies in the peri-infarct cortex with/without VPA administration. (A) Microglia/macrophages are morphologically dynamic cells able to change form from highly ramified to a completely amoeboid-like shape lacking processes. This transition can be very rapid under pathological conditions. The forms illustrated here represent snapshots of a transformation that is reversible at every time point, with variation with each form shown. (B–G) Complexity analysis of microglia/macrophages in CD11b-stained tissue. The process to prepare photomicrographs for complexity analysis: Original photomicrographs were subjected to a series of uniform ImageJ plugin protocols prior to conversion to binary images. Binary images were then analyzed by using FracLac for ImageJ, which quantifies single cell complexity (fractal dimension, fD). The calculated Df of the cell is shown below its binary image. Representative images of morphological changes in CD11b-staining cells within the sham-operated cortex in vehicle-treated rats (B), sham-operated cortex in VPA-treated rats (C), peri-infarct cortex at 2 days after 90-min dMCAo in vehicle-treated rats (D), peri-infarct cortex at 2 days after 90-min dMCAo in VPA-treated rats (E), peri-infarct cortex at 7 days after 90-min dMCAo in vehicle-treated rats (F), and peri-infarct at 7 days after 90-min dMCAo in VPA-treated rats (G). (H) Illustration of FracLac box counting method to derive fractal dimension calculations of a CD11b-positive cell outline. Shape detail is quantified as scale increase, represented by orange boxes. Box counting equation is summarized in Table 1. (I) Summary data and statistical analysis of fractal dimension at 2 and 7 days after ischemia. Fractal dimension was decreased in the peri-infarct cortex compared with the sham-operated cortex at 2 and 7 days post-stroke. However, VPA treatment restored the fractal dimension of CD11b-positive cells in the peri-infarct cortex at 2 days and 7 days post-stroke. All post hoc analyses are reported in the figure (2 days: ###p < 0.001 vs. sham and dMCAo + vehicle; ***p < 0.001 vs. dMCAo + vehicle and dMCAo + VPA; 7 days: #p < 0.05 vs. sham and dMCAo + vehicle; *p < 0.05 vs. dMCAo + vehicle and dMCAo + VPA). (J) The schemes illustrate graphically the calculation base for the circularity index for the manual analysis. Q22. (K,L) Soma size and circularity index were increased in the peri-infarct cortex compared with the sham-operated cortex at 2 and 7 days post-stroke. However, VPA treatment decreased the soma size and circularity index of CD11b-positive cells in the peri-infarct cortex at 2 and 7 days post-stroke. All post hoc analyses are reported in the figure (2 days: ###p < 0.001 vs. sham and dMCAo + vehicle; ***p < 0.001 vs. dMCAo + vehicle and dMCAo + VPA; 7 days: ###p < 0.001 vs. sham and dMCAo + vehicle; ***p < 0.001 vs. dMCAo + vehicle and dMCAo + VPA). Twenty-five to thirty cells per region of n = 4 rats in each group.

