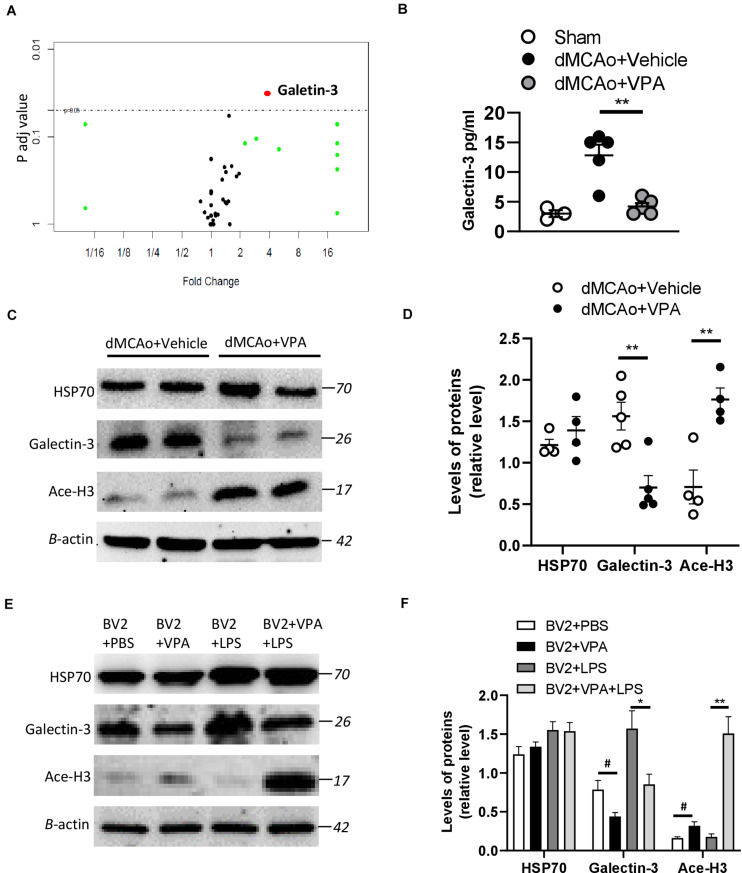
FIGURE 6.
Effects of VPA treatment on galectin-3 expression in the peri-infarct cortex and BV2 cells. (A) Volcano plot comparing the fold changes and adjusted p-values of 67 biomarkers in which each point represents a biomarker. (B) VPA suppresses galectin-3 production in the peri-infarct cortex of rats with ischemic brain injury. Galectin-3 concentrations in the peri-infarct cortex at 2 days after dMCAo surgery were measured by ELISA (n = 5). **p < 0.01, compared with the vehicle-treated group. (C) Protein levels of HSP70, acetylated H3 (Ace-H3), galectin-3, and β-actin were determined by western blot analysis. (D) Quantified results of HSP70, Ace-H3, and galectin-3. Each column and vertical bar represents the mean ± SEM of 5 animals. **P < 0.01, Student’s t-test. (E) BV2 cells were activated using LPS (1 μg/ml) and, simultaneously, in the presence or absence of VPA as indicated. After 6 h of treatment, the protein levels of HSP70, acetylated H3 (Ace-H3), galectin-3, and β-actin were determined by western blot analysis. (F) VPA treatment enhances the levels of Ace-H3, but suppresses galectin-3 production in the BV2 cells with/without LPS exposure. #p < 0.05 vs. control. *p < 0.05 and **p < 0.01 indicate comparison with LPS-treated BV2 cells with Student’s t-test. The data represent mean ± SEM.

