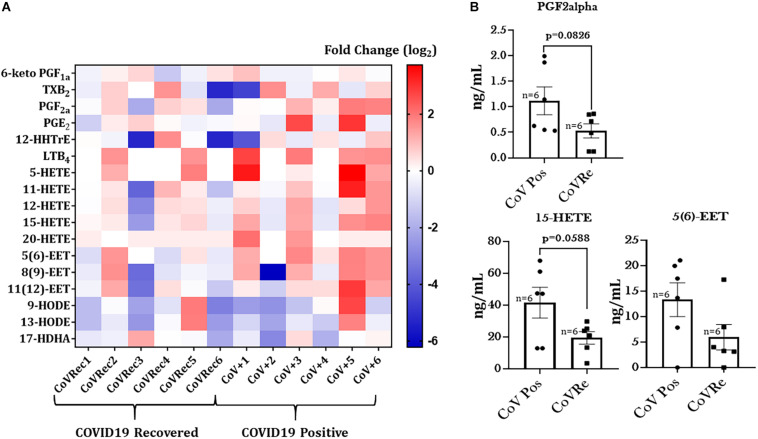
FIGURE 7.
Heat map of eicosanoid levels in COVID-19 positive and COVID-19 recovered patient serum. (A) The fold changes in the eicosanoid levels in COVID-19 recovered patient serum as compared to COVID-19 positive serum. Each horizontal row represents the analyte in a specific lipid class, and each vertical column represents the individual sample being tested. Lipid abundance ratios are colored according to the fold changes and the color key indicates the magnitude of log2 fold change. (B) The actual changes in the levels (ng/mL) of oxylipins showing slight variations amongst COVID-19 positive and COVID-19 recovered patients.

