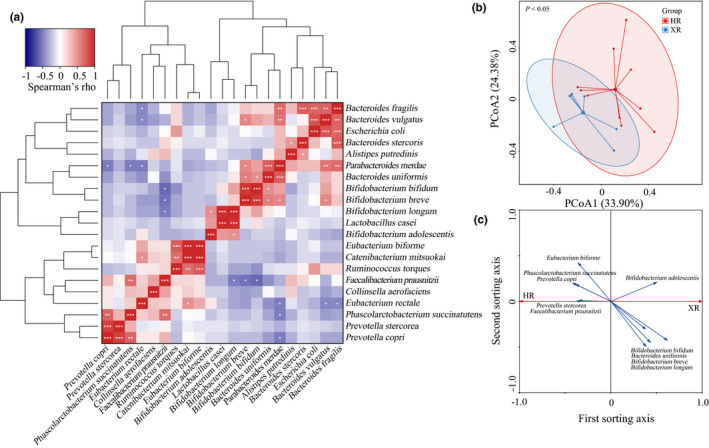
FIGURE 2.

Analysis of bacterial population structure based on multivariate statistics. (a) Pearson's rank correlation among twenty‐one dominant species (more than 1.00% of all sequences). Significant correlations are represented by ***p <.001, **0.001 < p < .01, *0.01 < p < .05, respectively. Principal coordinates analysis (PCoA) score plot of bacterial microbiome structure (b) and redundancy analysis (RDA) showing key responsive species (c). XR and HR represent Xilingol and Hongyuan herders, respectively
