FIGURE 5.

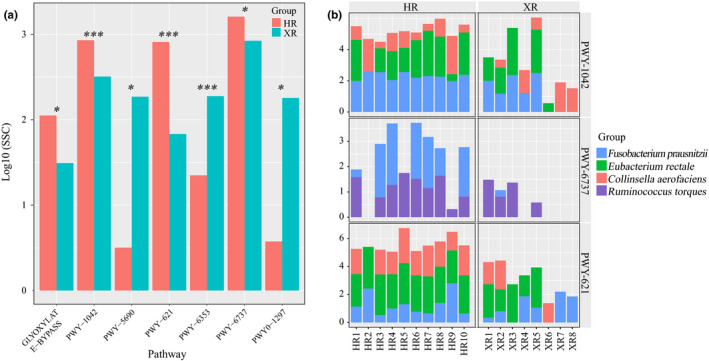
Identification of differentially abundant metabolic pathways and contributing species (a) Abundance bar graph of differentially abundant metabolic pathways in two groups. (b) Contribution of strains in different metabolic pathways. XR and HR represent Xilingol and Hongyuan herders, respectively. SSC represents the relative abundance of metabolic pathways. Significant correlations are represented by ***p < .001, **0.001 < p < .01, *0.01 < p < .05, respectively. GLYOXYLATE‐BYPASS: glyoxylate cycle, PWY‐1042: glycolysis IV (plant cytosol), PWY‐5690: TCA cycle II (plants and fungi), PWY‐621: sucrose degradation III (sucrose invertase), PWY‐6353: purine nucleotides degradation II (aerobic), PWY‐6737: starch degradation V and PWY0‐1297: superpathway of purine deoxyribonucleosides degradation
