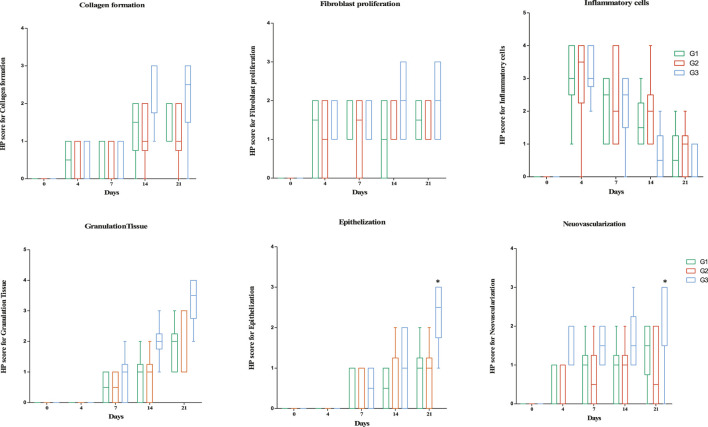
FIGURE 7.
Box plots of histopathology scores for skin parameters through treatment. Horizontal lines in boxes represent median and error bars represent minimum and maximum. *Significantly different from G2 [p < 0.05, Kruskal-Wallis test]. 0 = None, 1 = Rare or Minimal, 2 = Moderate, 3 = Abundant, and 4 = Severe or Marked.

