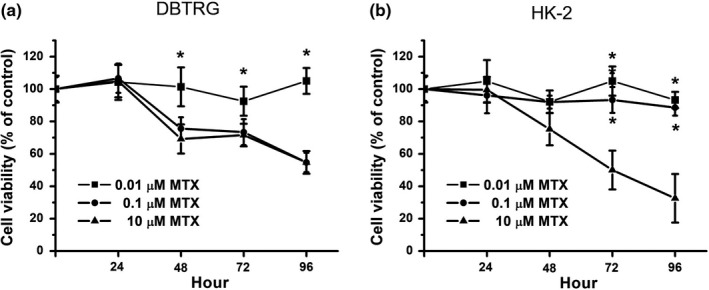
FIGURE 1.

Cell viability on MTX‐treated DBTRG and HK‐2 cells. (a) DBTRG cells were treated with 0.01, 0.1, or 10 μM MTX for 96 hr. (b) HK‐2 cells were treated with 0.01, 0.1, or 10 μM MTX for 96 hr. Cell viability was determined by MTT assay and calculated as A570 experimental group/A570 control group × 100%. Data were from four independent experiments and presented as mean ± SD. The * represents p < .05, compared with 10 μM MTX‐treated group
