
FIGURE 4.
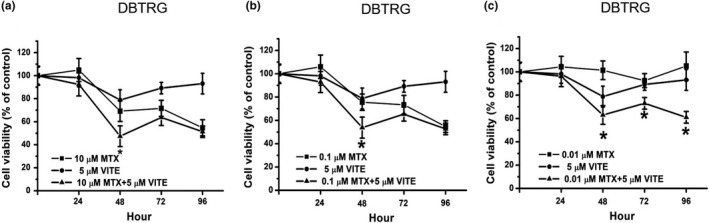
Cell viability on MTX, vitamin E, and MTX plus vitamin E‐treated DBTRG cells. (a) DBTRG cells were treated with 10 μM MTX, 5 μM vitamin E, or 10 μM MTX plus 5 μM vitamin E. (b) DBTRG cells were treated with 0.1 μM MTX, 5 μM vitamin E or 0.1 μM MTX plus 5 μM vitamin E. (c) DBTRG cells were treated with 0.01 μM MTX, 5 μM vitamin E, or 0.01 μM MTX plus 5 μM vitamin E. Cell viability was determined by MTT assay and calculated as A570 experimental group/A570 control group × 100%. Data were from four independent experiments and presented as mean ± SD. The * represents p < .05, compared with MTX‐treated group