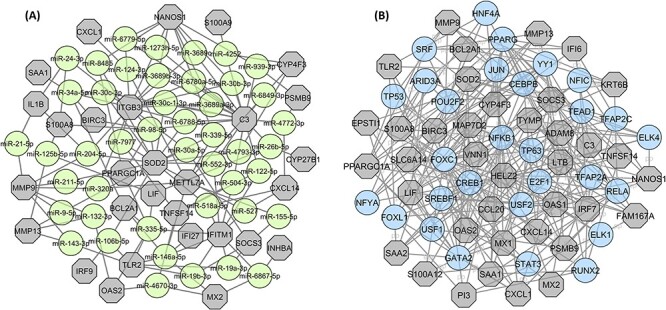
Figure 7.

Gene regulatory networks associated with the shared dysregulated genes. The figure showing (A) gene–miRNA interacting network and (B) gene–TF interacting network. The interacting network of miRNAs and TFs were filtered with degree centrality less than and equal to 2 and 5, respectively. In these networks, hexagons are shared DEGs, while lime and blue circles represent associated miRNAs or TFs, respectively.
