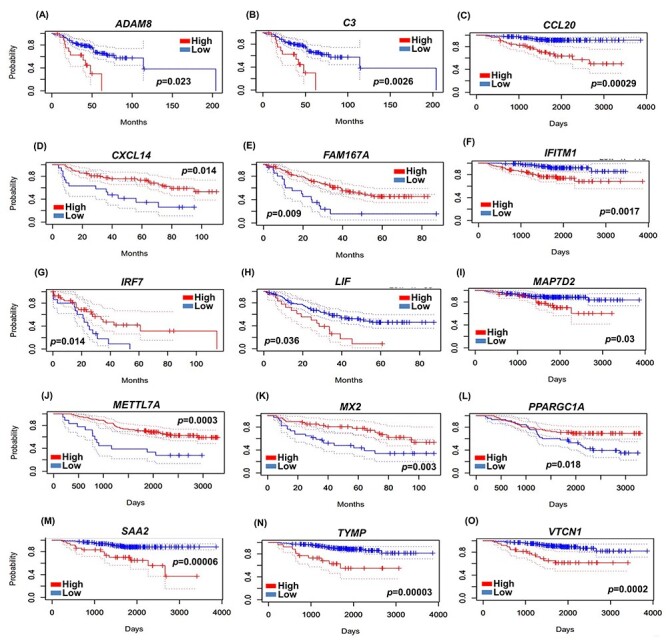
Figure 9.

The relationship between the expression of shared DEGs and survival of LC patients. In survival curves, red- and blue-colored lines represent overexpression and underexpression of the respective genes in patients’ survival, where (A–O) show OS of shared genes between COVID-19 and LC. Herein, five genes, such as CXCL14, MAP7D2, METTL7A, PPARGC1A and VTCN1, are downregulated in COVID-19 and the rest are upregulated.
